Download
1 / 20
200 likes | 271 Views
Examining Elements in Cereals. A Real World Project By Nicole Dixon and Amanda Lagace. Purpose.

E N D
Examining Elements in Cereals A Real World Project By Nicole Dixon and Amanda Lagace
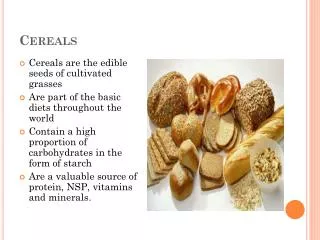
Purpose • The purpose of our experiment was to analyze the mineral content in cereal products in order to make a comparison to the reported values. The content analyses of sodium, potassium, magnesium, calcium, copper, iron, and zinc were performed by the ICP-OES, and the analyses of iron and zinc were performed again using the AA. We analyzed the content using a calibration curve made from standards of various concentrations, and the cereal products we analyzed were Cheerios, Total, Oatmeal Crisp, and Cocoa Puffs.
Method We began this procedure by creating 1L of 0.1M nitric acid to use as a solvent. We then created standards for the experiment. We made standards from the sodium, potassium, magnesium, calcium, copper, iron, and zinc stock solutions in concentrations of 10ppm, 20ppm, 30ppm, 40ppm, and 50ppm in 100mL volumetric flasks with nitric acid. We also set aside a blank of nitric acid for analysis. We then created our cereal samples for analysis. We first crushed 0.1g of cereal with a mortar and pestle and dissolved it in 100mL of nitric acid. We used a stir plate for several minutes in order to dissolve most of the sample. What could not be dissolved we filtered out of the solution with filter paper. We ran the blank, standards, and samples on the ICP for the presence of the seven elements. We used the information from the standard to create a calibration curve in order to determine the concentration of the elements in the samples. We then ran the blank, standards, and samples on the AA for the presence of zinc and iron, using the information from the standards again to create a calibration curve to determine the sample concentrations. We used the concentration determined by experimentation to compare to the reported values on the cereal boxes and we calculated the percent difference between the two.
Iron Zinc Data-AA • AA Data Iron: Zinc
Even More Data Reported values of elements in one serving of each cereal product: Calculated theoretical values of elements in 0.1g of cereal in 100mL of solvent based on reported values
Sample Calculations Example Calculations of Theoretical Values:
Conclusions • The best results came from Potassium. • The cereal with the lowest percent differences overall was Cheerios. • The cereal with the worst numbers was Oatmeal Crisp. • The worst results elementally was iron. • Most of the elements with higher percent differences were those with lower reported concentrations in the cereals.
What Went Wrong (Possibly) • Dissolving the flaky cereals. • Filtering the cereals. • Concentrations of standards. • Low concentration of cereal in the samples. (Used 0.1g in 100 mL) • Difference between ICP and AA.