Download
1 / 16
170 likes | 179 Views
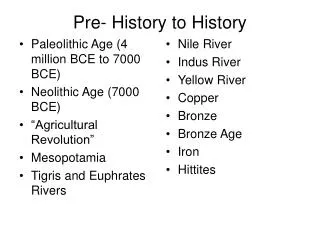
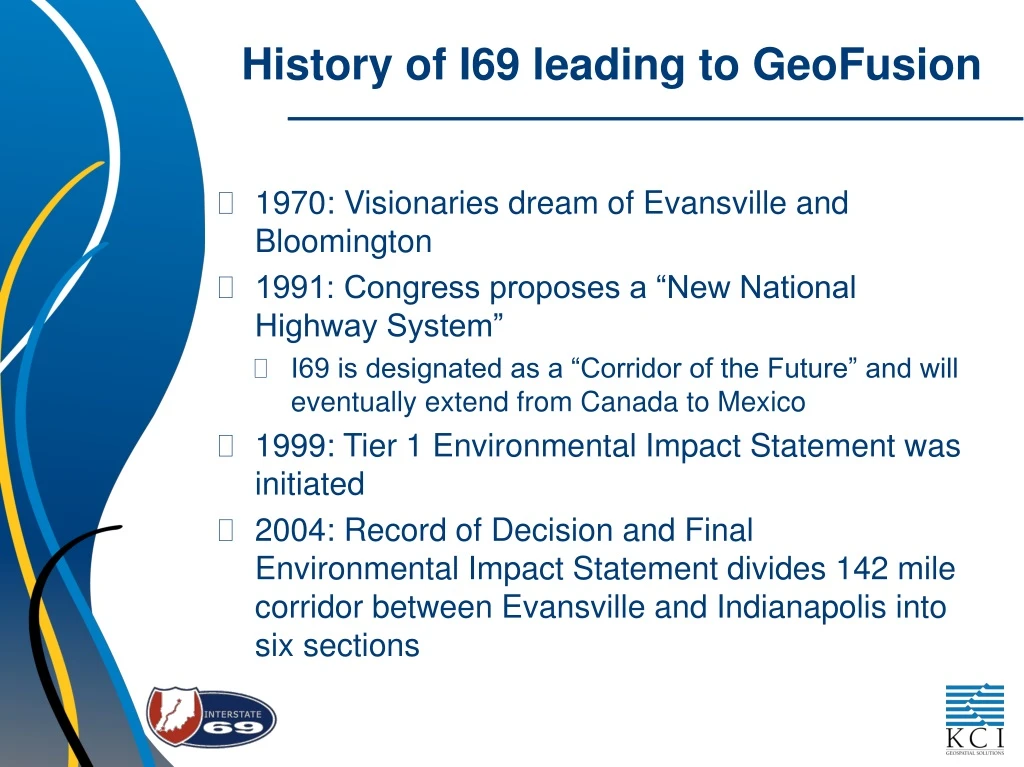
History of I69 leading to GeoFusion. 1970: Visionaries dream of Evansville and Bloomington 1991: Congress proposes a “New National Highway System” I69 is designated as a “Corridor of the Future” and will eventually extend from Canada to Mexico

E N D
History of I69 leading to GeoFusion • 1970: Visionaries dream of Evansville and Bloomington • 1991: Congress proposes a “New National Highway System” • I69 is designated as a “Corridor of the Future” and will eventually extend from Canada to Mexico • 1999: Tier 1 Environmental Impact Statement was initiated • 2004: Record of Decision and Final Environmental Impact Statement divides 142 mile corridor between Evansville and Indianapolis into six sections
History of I69 leading to GeoFusion • 2010: KCI Technologies begins monitoring at Pigeon Creek Mitigation Site, a Section 1 site • 2011: The inception of GeoFusion • 2014: Process begins of revising to meet current need and changes in technology • 2016: All mitigation monitoring reports are submitted to their respective agencies via GeoFusion creating a paperless and interactive submittal process
GeoFusion Statistics • 142 miles of road, 6 sections • Mitigation for wetland, streams, and habitat for endangered species (Indiana bat) • Sections 2 and 4 created 1,508 acres of preservation only sites • Sections 1-4 created 33 sites totaling 3,979 acres of constructed sites requiring monitoring and annual reporting • Sections 5 is coming into monitoring beginning this year • Section 6 is being designed
GeoFusion Statistics • 1,140 files linked from SharePoint to ArcGIS Online • 608 independent layers • 19 feature classes • SharePoint also includes background files such as design plans Red bat (Lasiurus borealis) Indiana State Species of Special Concern
Project Technical Details • “GeoFusion” originally was the name of a custom application written for tracking a similar project in Maryland. MD100 in Ellicott City MD • Project was developed in Silverlight and often used as a means to connect SharePoint with ESRI spatial data • Deployed successfully in MD and DE • Same Silverlight project framework deployed for I69 to test
Delaware Demonstration DeldotDemonstration
Oh No! Silverlight is not supported! • A technology shift away from application frameworks such as Flex and Silverlight began to take place in 2009. • Support for Silverlight began to wane in 2011 and it became fully unsupported in Chrome by the end of 2014 • Thankfully INDOT had not deployed the application beyond the internal testing environment in 2014 as the need for it had not matured. • A brief evaluation of currently available tools led to the decision to move the application framework over to ArcGIS Online
Why ArcGIS Online? • COTS product • Industry is trending toward COTS at the moment • AGOL is already in place at INDOT • Goal is to eventually turn the project over to INDOT to manage and maintain. • Budget considerations • More funding could be spent on data enhancements then on a custom app • Loose coupling available to SharePoint • Multiple future options including ESRI Maps for SharePoint
Application Configuration • 2 Components – SharePoint & AGOL • SharePoint • Document Storage • Photos • Reports • Graphs and Charts • Organized by Year • Naming convention is key to automation • AGOL • 5 AGOL Map Applications • 1 per section • 1 overall map • Widgets enabled – Print, Measure, Bookmarks, and About
Project Workflow • Field Work Completed • GIS Data Compiled • Photographs Evaluated • Reports Created • Data Uploaded to SharePoint • Python Processing • Process GIS Files (Assembly) • Establish linkages • Test linkages • Reporting on data quality • GIS Data Loaded into AGOL
Python Processing Configuration • Python version 2.7 for ArcGIS 10.3 • PIP installer for Python (for installing libraries) • Libraries • Requests (reading html response) • requests_ntlm (html a)uthorization • csv (writing csv files) • xlrd (reading Excel files) • PyScripter for IDE
Python Processing Steps • The Data • 32 Sites • 32 Geodatabases with matching schemas • 19 Layers in each gdb • Why not sde? • Easy to keep sites independent • Easy to update • Easy to deploy • Easy to merge back together • Spreadsheet keeps track of which sites to process • Spreadsheet also determines which layers to process
Python Processing Steps • Naming Conventions • Boundary Report : I69_BeechCreek_Report_MY01_Final • Gage Points: I-69_Hydrographs_DoansCreek_MY01_WG1 • Photo Reference Points: IC1_PRP1_MY01 • Stream Photo Points: SP10.JPG
Demonstration • I69 Overall Map