Download
1 / 5
221 likes | 2.02k Views
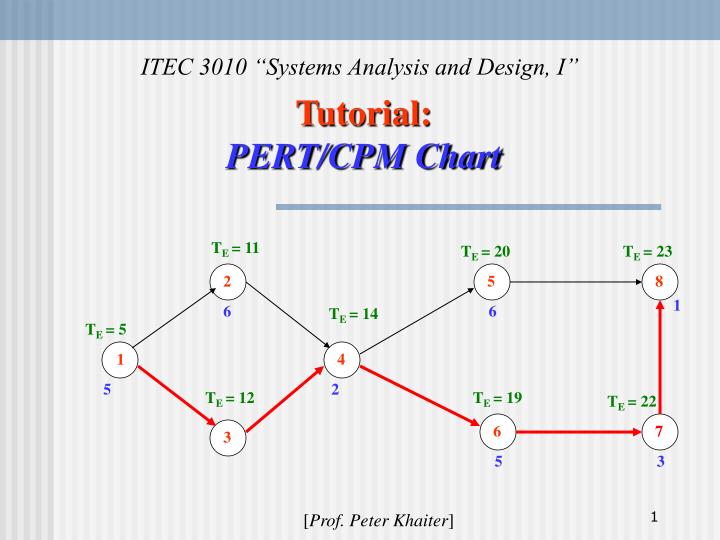
ITEC 3010 “Systems Analysis and Design, I”. Tutorial: PERT/CPM Chart. T E = 11. T E = 20. T E = 23. 2. 5. 8. 1. 6. 6. T E = 14. T E = 5. 1. 4. 5. 2. T E = 12. T E = 19. T E = 22. 6. 7. 3. 5. 3. [ Prof. Peter Khaiter ]. PERT/CPM Chart.

E N D
ITEC 3010 “Systems Analysis and Design, I” Tutorial:PERT/CPM Chart TE = 11 TE = 20 TE = 23 2 5 8 1 6 6 TE = 14 TE = 5 1 4 5 2 TE = 12 TE = 19 TE = 22 6 7 3 5 3 [Prof. Peter Khaiter]
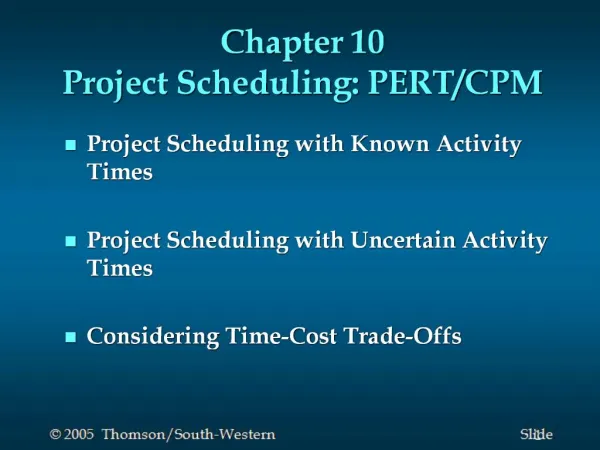
PERT/CPM Chart Task.A project has been defined to contain the following list of activities along with their required times for completion: a. Draw a PERT chart for the activities. b. Calculate the earliest expected completion time. c. Show the critical path.
PERT/CPM Chart (cont’d) • Draw a PERT chart for the activities. • Using information from the table, show the sequence of activities. 2 5 8 1 4 6 7 3
PERT/CPM Chart (cont’d) b. Calculate the earliest expected completion time. 1. Using information from the table, indicate expected completion time for each activity. TE = 11 TE = 20 TE = 23 2 5 8 1 6 6 TE = 14 TE = 5 1 4 5 2 TE = 12 TE = 19 TE = 22 6 7 3 5 3 7 2. Calculate earliest expected completion time for each activity (TE) and the entire project. Hint:the earliest expected completion time for a given activity is determined by summing the expected completion time of this activity and the earliest expected completion time of the immediate predecessor. Rule: if two or more activities precede an activity, the one with the largest TE is used in calculation (e.g., for activity 4, we will use TE of activity 3 but not 2 since 12 > 11).
PERT/CPM Chart (the end) c. Show the critical path. TE = 11 TE = 20 TE = 23 2 5 8 1 6 6 TE = 14 TE = 5 1 4 5 2 TE = 12 TE = 19 TE = 22 6 7 3 5 3 The critical path represents the shortest time, in which a project can be completed. Any activity on the critical path that is delayed in completion delays the entire project. Activities not on the critical path contain slack time and allow the project manager some flexibility in scheduling.