Download
1 / 57
920 likes | 1.92k Views
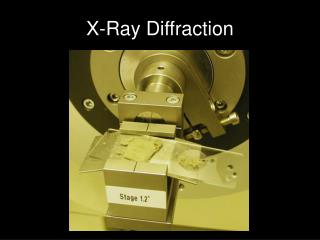
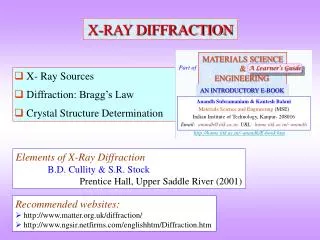
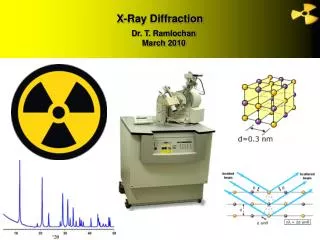
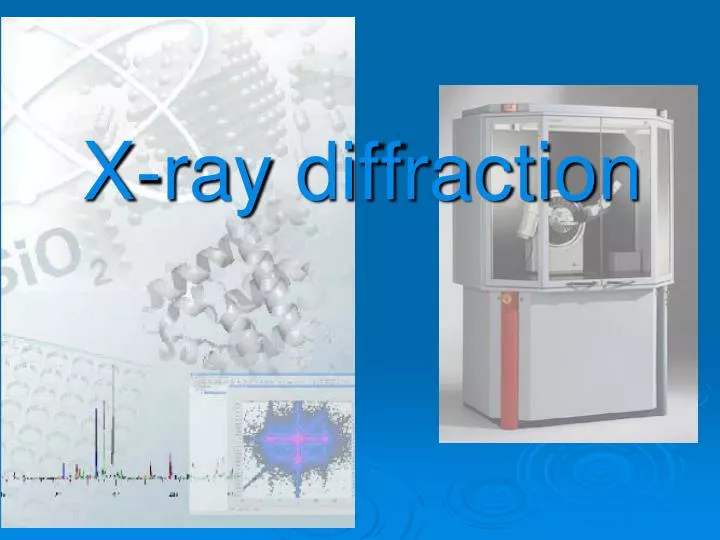
X-ray diffraction. Equipment. Bruker D8 Analytical X-ray Systems. X-ray beam source.

E N D
Equipment Bruker D8 Analytical X-ray Systems
X-ray beam source • Bruker D8 ADVANCE uses an x-ray tube with a Cu anode as the primary x-ray beam source. In this component x-rays are generated when a focused electron beam accelerated across a high voltage field bombards a stationary solid Cu target. As electrons collide with atoms in the target and slow down, a continuous spectrum of x-rays is emitted, which is termed Bremsstrahlung radiation. • The high energy electrons also eject inner shell electrons in atoms through the ionization process. When a free electron fills the shell, an x-ray photon with energy characteristic of the target material is emitted. • Common targets used in x-ray tubes include Cu and Mo, that emit 8 keV and 14 keV x-rays with corresponding wavelengths of 1.54 Å and 0.8 Å, respectively.
Wavelengths for X-Ray source • Often quoted values from Cullity (1956) and Bearden, Rev. Mod. Phys. 39 (1967) are incorrect. • Values from Bearden (1967) are reprinted in international Tables for X-Ray Crystallography and most XRD textbooks. • Most recent values are from Hölzer et al. Phys. Rev. A56 (1997)
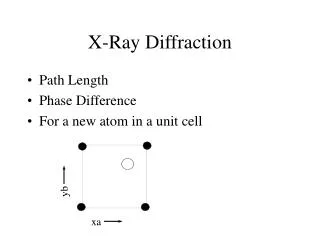
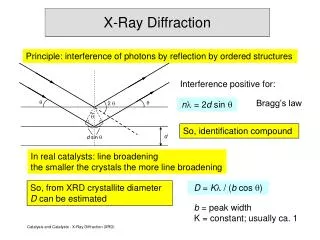
BRAGG’s EQUATION Deviation = 2 Ray 1 Ray 2 d dSin • The path difference between ray 1 and ray 2 = 2d Sin • For constructive interference: n = 2d Sin
θ - 2θ Scan The θ - 2θ scan maintains these angles with the sample, detector and X-ray source Normal to surface Only planes of atoms that share this normal will be seen in theθ - 2θ Scan
Powder diffraction data can be collected using either transmission or reflection geometry, as shown below. Because the particles in the powder sample are randomly oriented, these two methods will yield the same data
Incident X-rays SPECIMEN Heat Fluorescent X-rays Electrons Scattered X-rays Compton recoil Photoelectrons Incoherent (Compton modified) From loosely bound charges Coherent From bound charges Transmitted beam • X-rays can also be refracted (refractive index slightly less than 1) and reflected (at very small angles) • Refraction of X-rays is neglected for now.
How does it work? In powder XRD method, a sample is ground to a powder (±10µm) in order to expose all possible orientations to the X-ray beam of the crystal values of , d and for diffraction are achieved as follows: 1. is kept constant by using filtered X- radiation that is approximately monochromatic. 2. d may have value consistent with the crystal structure 3. is the variable parameters, in terms of which the diffraction peaks are measured.
How does XRD Works??? • Every crystalline substance produce its own XRD pattern, which because it is dependent on the internal structure, is characteristic of that substance. • The XRD pattern is often spoken as the “FINGERPRINT” of a mineral or a crystalline substance, because it differs from pattern of every other mineral or crystalline substances.
Basic Component Of XRD Machine • Therefore any XRD machine will consist of three basic component. • Monochromatic X-ray source () • Sample-holder (goniometer). • Data collector- such as film, strip chart or magnetic medium/storage. By varying the angle , the Bragg’s Law conditions are satisfied by different d-spacing in polycrystalline materials. Plotting the angular positions and intensities of the resultant diffraction peaks produces a pattern which is characterised of the sample
X-ray Components A typical X-ray instrument is built by combining high performance components such as X-ray tubes, X-ray optics, X-ray detectors, sample handling device etc. to meet the analytical requirements. A consequent modular design is the key to configure the best instrumentation. .
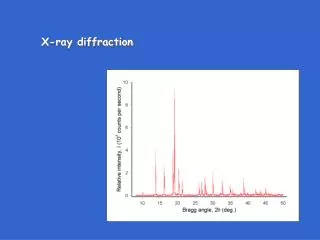
Diffraction Pattern Collected Where A Ni Filter Is Used To Remove Kβ Kb
Typical experimental data from Bruker XRD TiO2 I 101 Anatase 110 Rutile 2
101 Anatase 110 Rutile
Examples of 3D Reciprocal Lattices weighed in with scattering power (|F|2) SC 001 011 101 111 Lattice = SC 000 010 100 110 No missing reflections Reciprocal Crystal = SC Figures NOT to Scale
002 022 BCC 202 222 011 101 020 000 Lattice = BCC 110 200 100 missing reflection (F = 0) 220 Reciprocal Crystal = FCC Weighing factor for each point “motif” Figures NOT to Scale
002 022 FCC 202 222 111 020 000 Lattice = FCC 200 220 100 missing reflection (F = 0) 110 missing reflection (F = 0) Weighing factor for each point “motif” Reciprocal Crystal = BCC Figures NOT to Scale
Side Drift Mount Designed to reduce preferred orientation – great for clay samples, (and others with peaks at low 2-theta angles)
Match The Sample/Measurement Conditions With The Diffraction Pattern 1 2 3
200 220 111 222 311 • Rock Salt Why are peaks missing? JCPDF# 01-0994 • The sample is made from Morton’s Salt • JCPDF# 01-0994 is supposed to fit it (Sodium Chloride Halite)
200 220 111 222 311 It’s a single crystal 2q The (200) planes would diffract at 31.82 °2q; however, they are not properly aligned to produce a diffraction peak The (222) planes are parallel to the (111) planes. At 27.42 °2q, Bragg’s law fulfilled for the (111) planes, producing a diffraction peak.
A random polycrystalline sample that contains thousands of crystallites should exhibit all possible diffraction peaks 200 220 111 222 311 2q 2q 2q • For every set of planes, there will be a small percentage of crystallites that are properly oriented to diffract (the plane perpendicular bisects the incident and diffracted beams). • Basic assumptions of powder diffraction are that for every set of planes there is an equal number of crystallites that will diffract and that there is a statistically relevant number of crystallites, not just one or two.
Intensity (a.u.) 66 67 68 69 70 71 72 73 74 2 q (deg.) Which of these diffraction patterns comes from a nanocrystalline material? Hint: Why are the intensities different? 1o 0.0015o • These diffraction patterns were produced from the exact same sample • The apparent peak broadening is due solely to the instrumentation • 0.0015° slits vs. 1° slits optical cofigurations • Scan speed ( stepsize) http://prism.mit.edu/xray
Crystallite Size Broadening Scherrer’s Formula • Peak Width B(2q) varies inversely with crystallite size • The constant of proportionality, K (the Scherrer constant) depends on the how the width is determined, the shape of the crystal, and the size distribution • the most common values for K are 0.94 (for FWHM of spherical crystals with cubic symmetry), 0.89 (for integral breadth of spherical crystals with cubic symmetry, and 1 (because 0.94 and 0.89 both round up to 1). • K actually varies from 0.62 to 2.08 • For an excellent discussion of K, refer to JI Langford and AJC Wilson, “Scherrer after sixty years: A survey and some new results in the determination of crystallite size,” J. Appl. Cryst.11 (1978) p102-113. • Remember: • Instrument contributions must be subtracted
Scherrer’s Formula t = thickness of crystallite / crystallite size K = constant dependent on crystallite shape (0.89) l = x-ray wavelength B = FWHM (full width at half max) or integral breadth qB = Bragg Angle
Scherrer’s Formula What is B? B = (2θ High) – (2θ Low) B is the difference in angles at half max Peak 2θ high 2θ low Noise
When to Use Scherrer’s Formula • Crystallite size <1000 Å • Peak broadening by other factors • Causes of broadening • Size • Strain • Instrument • If breadth consistent for each peak then assured broadening due to crystallite size • K depends on definition of t and B • Within 20%-30% accuracy at best Sherrer’s Formula References Corman, D. Scherrer’s Formula: Using XRD to Determine Average Diameter of Nanocrystals.
Scherrer’s Example t = 0.89*λ / (B Cos θB) λ= 1.54 Ǻ = 0.89*1.54 Ǻ / ( 0.00174 * Cos (98.25/ 2 ) ) = 1200 Ǻ B = (98.3 - 98.2)*π/180 = 0.00174 Simple Right!
Intensity (a.u.) 46.7 46.8 46.9 47.0 47.1 47.2 47.3 47.4 47.5 47.6 47.7 47.8 47.9 2 q (deg.) Intensity (a.u.) 46.7 46.8 46.9 47.0 47.1 47.2 47.3 47.4 47.5 47.6 47.7 47.8 47.9 2 q (deg.) Methods used to Define Peak Width • Full Width at Half Maximum (FWHM) • the width of the diffraction peak, in radians, at a height half-way between background and the peak maximum • Integral Breadth • the total area under the peak divided by the peak height • the width of a rectangle having the same area and the same height as the peak • requires very careful evaluation of the tails of the peak and the background FWHM
Remember, Crystallite Size is Different than Particle Size • A particle may be made up of several different crystallites • Crystallite size often matches grain size, but there are exceptions http://prism.mit.edu/xray
Anistropic Size Broadening • The broadening of a single diffraction peak is the product of the crystallite dimensions in the direction perpendicular to the planes that produced the diffraction peak. http://prism.mit.edu/xray
Intensity (a.u.) 47.0 47.2 47.4 47.6 47.8 2 q (deg.) Instrumental Peak Profile • A large crystallite size, defect-free powder specimen will still produce diffraction peaks with a finite width • The peak widths from the instrument peak profile are a convolution of: • X-ray Source Profile • Wavelength widths of Ka1 and Ka2 lines • Size of the X-ray source • Superposition of Ka1 and Ka2 peaks • Goniometer Optics • Divergence and Receiving Slit widths • Imperfect focusing • Beam size • Penetration into the sample Patterns collected from the same sample with different instruments and configurations at MIT http://prism.mit.edu/xray