Download

1 / 82
880 likes | 1.19k Views
Quality…. Quality Assurance Quality Control Quality System Quality Management. Quality assurance. A well defined, organized program design to enhance patient care through the ongoing objective assessment aspects of patient care and the correction of identified problems

E N D
Quality…. • Quality Assurance • Quality Control • Quality System • Quality Management
Quality assurance • A well defined, organized program design to enhance patient care through the ongoing objective assessment aspects of patient care and the correction of identified problems • Planned and systematic activities to provide adequate confidence that requirements for quality will be met • Includes IQC, EQA, pre-analytic phase, test standardization, post-analytic phase, management, and organization
The Quality Assurance Cycle Pre-Analytic Patient/Client Prep Sample Collection Personnel Competency Test Evaluations Reporting • Data and Lab Management • Safety • Customer Service Post-Analytic Sample Receipt and Accessioning Record Keeping Sample Transport Quality Control Testing Analytic
Quality Assurance Target • Preanalytical Process • Anticuagulant,labeling,storage… • Postanalytical Process • How report,time of report,… • *never rely on a single value(out of reference range) to make a diagnosis • *oslers rule: Try to attribute all abnormal findings to a single case • Analytical Process • Internal QC • External QC
Quality Assurance Programme • Internal Quality Control (IQC) Procedures • External Quality Assessment (EQA) • Quality Management The ultimate goal of quality system is to obtain test results that are Reliable, relevant and reproducible.
Quality Control • Quantitative and statistical • Process or system for monitoring the quality of laboratory testing, and the accuracy and precision of results • Routinely collect and analyze data from every test run or procedure • Allows for immediate corrective action • AIM: to reduce both systematic and random error
Internal Quality Control • set of procedures for continuously assessing laboratory work and the emergent results; immediate effect, should actually control release of results
External Quality Assessment • Evaluates past performance • Testing of unknown samples • Compare performance with others • Provides a forum for improvements and correction of errors
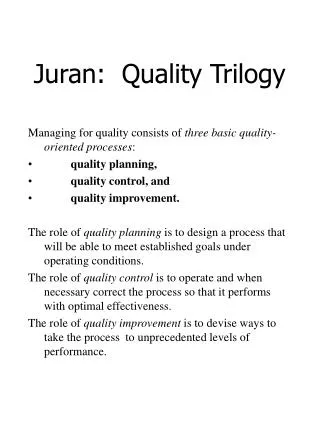
Quality Management • All activities of the overall management function that determine quality policy objectives, implement them by means such as quality planning, quality control, quality assurance, and quality improvement within the system
Quality System • Organizational structure, resources, processes and procedures needed to implement quality management
Quality System Quality Assurance Quality Control
and Precision Accuracy
Precise and inaccurate • Precise and accurate
Measures of Central Tendency • Mean= the calculated average of the values • Median= the value at the center (midpoint) of the observations • Mode= the value which occurs with the greatest frequency
Calculation of Mean X = Mean X1 = First result X2 = Second result Xn = Last result in series n – Total number of results 185-182-179-183-178-176-183-184-177-186 (g/l) mean=1813/10=181.3
Median • اگر تعدادی خوانده داشته باشیم و به ترتیب صعودی یا نزولی ردیف کنیم ، عددی که دو طرف آن تعداد خوانده ها برابر باشد • فرد (n+1) / 2 • 150-140-120-140-130-100-110 • 150-140-140-130-120-120-110 • N+1/2=8/2=4 • زوج n/2 + (n/2)+1}/2} • 150-140-120-140-130-100-110-120 • 150-140-140-130-120-120-110-100 • n/2=8/2=4 n/2+1=4+1=5 125 = 2 /(130+120)
Mode • نما عبارت است از داده ای که بیشترین فراوانی را دارد 120-110-140-155-125-110-135-110-143 • 110
Measures of Dispersion or Variability • There are several terms that describe the dispersion or variability of the data around the mean: • Range • Variance • Standard Deviation • Coefficient of Variation
Range • Range refers to the difference or spread between the highest and lowest observations. • It is the simplest measure of dispersion. • It makes no assumption about the shape of the distribution or the central tendency of the data.
Range • دامنه عبارت است از فاصله بیشترین مقدار تا کمترین مقدار • 7-8-9-12-16 • Range=16-7=9
Normal Distribution • All values are symmetrically distributed around the mean • Characteristic “bell-shaped” curve • Assumed for all quality control statistics
Normal Distribution CurveGaussian Curve Mean-Mode-Median • 1SD • 2SD • 3SD
Variance • Variance is a measure of variability about the mean. • It is calculated as the average squared deviation from the mean. • the sum of the deviations from the mean, squared, divided by the number of observations (corrected for degrees of freedom)
For a set of data with a normal distribution, a value will fall within a range of: +/- 1 SD 68.2% of the time +/- 2 SD 95.5% of the time +/- 3 SD 99.7% of the time Frequency 68.2% 95.5% 99.7% -3s - 2s -1s Mean +1s +2s +3s Standard Deviation and Probability
Calculation of Coefficient of Variation • The coefficient of variation (CV) is the standard deviation (SD) expressed as a percentage of the mean
Quality assurance programme a)At all time: *Correlation system -Cumulative report forms -Blood film with blood count -Blood count with clinical data
Rules of Three for normal Hematology • Rule #1 • Hgb X 3 = Hct +2 • Rule #2 • RBC x 3.3 = Hgb + 1.5 • Rule #3 • RBC x 9 = Hct +3 Not for calibration
….QA prog. b) Daily • Test on control specimen Levey jenning control chart 2. Duplicate test on patents specimen 3. Check test 4. Delta test 5. Daily mean
Control Chart : example 2sd=0.66
Westgard Rules : • 1 2s warning • 1 3s Reject • 2 2s “ • 4 1s “ • R 4s “ • 6 or 10 warning
Drift /Trend • Shift • Dispersion
Dispersion • Look for widely scatter data points. • 1] fluctuating electrical voltage (stability problem) [2] poor mixing of control specimens (inconsistency in technique).