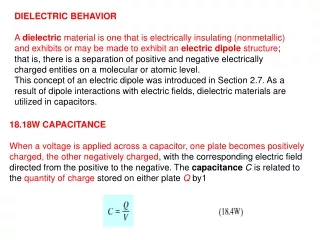
Complex dielectric permittivity
Complex dielectric permittivity The relative complex dielectric permittivity of a medium, e r ( f ), describes the energy propagation characteristics of the electrical component of electromagnetic radiation within that medium.

Complex dielectric permittivity
E N D
Presentation Transcript
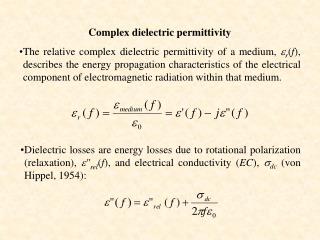
Complex dielectric permittivity • The relative complex dielectric permittivity of a medium, er(f), describes the energy propagation characteristics of the electrical component of electromagnetic radiation within that medium. • Dielectric losses are energy losses due to rotational polarization (relaxation), e"rel(f), and electrical conductivity (EC), sdc (von Hippel, 1954):
Cole-Cole (1941) model for modeling of complex dielectric constant The relative dielectric permittivities of most materials may be described via the Cole-Cole (1941) model: where e∞ is the dielectric constant at infinite frequency, es the static dielectric constant (where f = 0 Hz) and b a factor accounting for possible spread in relaxation frequencies.
Relaxation losses are greatest at the relaxation frequency, frel. • EC losses are greatest at lower frequencies, with the greatest loss occurring at f = 0 Hz (DC). • Where f << frel, e’(f) is directly proportional to the viscosity of the medium. • frel is inversely proportional to viscosity. • Viscosity is inversely proportional to temperature. • As f increases toward frel, e’(f) will begin to decrease, with the greatest decreases occurring in the vicinity of frel.
Relax. freq. 5°C Relax. freq. 25°C Relax. freq. 25°C Figure 1: Dielectric permittivity of water as predicted via the Cole-Cole (1941) model and measured using a network analyzer at 5, 25 and 55°C.
Figure 2. er of distilled water at P, L, C and X bands as a function of temperature. Solid black and red symbols represent measured real and imaginary e values, respectively. Please note that measured values for e’ at 420 MHz and 1.26 GHz are overlapping.
A e” dominated by EC losses e” dominated by relaxation B C Figure 3A-C: Dielectric permittivities of DDW and 3 CaCl2 solutions at A. 5°C, B. 25°C and C. 55°C.