Download
1 / 35
350 likes | 474 Views
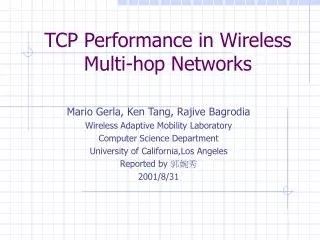
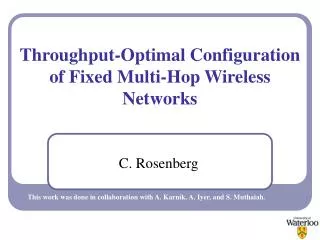
INFOCOM 2006. Modeling Per-flow Throughput and Capturing Starvation in CSMA Multi-hop Wireless Networks. Michele Garetto Theodoros Salonidis Edward W. Knightly. Rice Networks Group http://www.ece.rice.edu/networks. Example : 50 nodes. 1000. 900. 800. 700. 600. Y (meters). 500. 400.

E N D
INFOCOM 2006 Modeling Per-flow Throughput and Capturing Starvation in CSMA Multi-hop Wireless Networks Michele Garetto Theodoros Salonidis Edward W. Knightly Rice Networks Group http://www.ece.rice.edu/networks
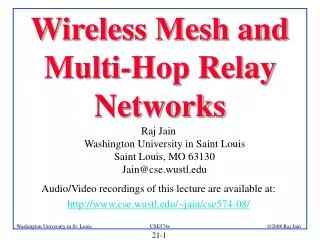
Example : 50 nodes 1000 900 800 700 600 Y (meters) 500 400 300 200 100 0 0 100 200 300 400 500 600 700 800 900 1000 X (meters)
Example : 50 nodes 1000 50 tx-rx pairs 900 Saturated traffic 800 802.11 DCF 700 (CSMA/CA) 600 Y (meters) 500 Ideal channel 400 300 200 100 0 0 100 200 300 400 500 600 700 800 900 1000 X (meters)
Example : 50 nodes Sensing range 1000 Single cell 900 800 700 600 Y (meters) 500 400 300 200 100 0 0 100 200 300 400 500 600 700 800 900 1000 X (meters)
Example : 50 nodes 50 Single cell 40 30 Throughput (pkt/s) 20 10 0 0 5 10 15 20 25 30 35 40 45 50 Rank
1000 900 800 700 600 Y (meters) 500 400 300 200 100 0 0 100 200 300 400 500 600 700 800 900 1000 X (meters) Example : 50 nodes 1000 Sensing Range = 400m 900 800 700 600 500 400 300 200 100 0 0 100 200 300 400 500 600 700 800 900 1000
Example : 50 nodes 250 A few rich flows 200 150 Throughput (pkt/s) 100 Many starving flows ! 50 0 0 5 10 15 20 25 30 35 40 45 50 Rank
Our contributions • We develop an analytical model to compute per-flow throughput in arbitrary network topologies employing 802.11 DCF • We explain the origin of starvation in CSMA-based wireless mesh networks • We propose metrics to quantify starvation due to the MAC
The model • The channel “private view” of a node: successful transmission busy channel due to activity of other nodes idle slot collision … t … • Modelled as a renewal-reward process P [event Ts occurs] Throughput (pkt/s) = Average duration of an event (s)
Event probabilities: The model • Define, for each node, the probabilities = probability that the node sends out a packetin a slot = conditional collision probability = conditional busy channel probability … … t
Analysis (for backlogged flows) (a decreasing function of p ) [Bianchi ’00] • The unknown variables for each node are: • Throughput formula: • The throughput of a node decreases if either: • is large (large collision probability) • is large (large fraction of busy time)
The origin of starvation • A node “starves” if either: • the conditional packet loss probability or • the fraction of time sensed busy (or both) are “disproportionally” large as compared to its neighbors (which are expected to have similar throughput)
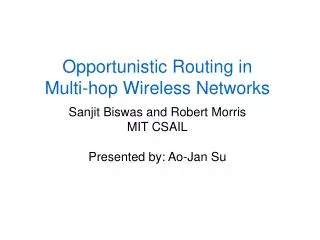
a A b B How canp be disproportionally large ? The “information asymmetry” scenario
idle time of A • channel at node A: busy time of A How can bTbbe disproportionally large ? The “flow-in-the-middle” scenario Flow Aa starves due to large fraction of busy time a c b C B A
The model • Incorporates known starvation effects due to the MAC protocol and predict their impact in the presence of many nodes • Requires solving a coupled non-linear multivariate system of equations • System is very sensitive to local perturbations (chaotic system ?) • Can analyze arbitrary topologies • Predicts individual flow throughput • Has been extended to non-saturated flows
Model vs Sim – 50-nodes example 300 sim model 250 200 150 Throughput (pkt/s) 100 50 0 0 5 10 15 20 25 30 35 40 45 50 Rank
Model vs Sim – 50-nodes example 1 sim 0.9 model 0.8 0.7 0.6 0.5 Packet Loss Probability 0.4 0.3 0.2 0.1 0 1 0.9 0.8 0.7 0.6 Fraction of busy time 0.5 0.4 0.3 0 5 10 15 20 25 30 35 40 45 50 Rank
How to measure starvation ? • We must separate out starvation due to MAC from natural throughput unbalance due to topology (different number of contenders) • We take a reference system in which starvation due to MAC is structurally eliminated : • Slotted aloha (proportional fairness can be achieved by properly setting nodes’ transmission probabilities [Kar ’04]) • We compare the two system using various metrics • aggregate metrics are not adequate • we consider how individual flows are treated in the two systems
Disproportionality index Aloha prop. fair. 802.11 • Provides a measure of starvation which is independent of aggregate network throughput • 50-nodes example: D = 0.39
Conclusions • Multi-hop wireless networks employing 802.11 (or other variants of CSMA) are subject to severe starvation (under heavy load) • This is a fundamental problem due to lack of coordination between out-of-range transmitters • System performance strongly depends on network topology • We developed an analytical model to predict per-flow throughput in arbitrary topologies and characterize starvation
500 11 flows 12 flows 450 400 350 300 Packet Throughput 250 200 150 100 50 0 0 1 2 3 4 5 6 7 8 9 10 11 Flow index Propagation effects Sensing range = tx Range = 100 m 10 Y (meters) 0 0 200 400 600 800 1000 X (meters)
Example : 50 nodes 1000 Sensing Range= 200 m 900 Tx Range = 200 m 800 50 tx-rx pairs 700 600 Y (meters) 500 400 300 200 100 0 0 100 200 300 400 500 600 700 800 900 1000 X (meters)
Model vs simulation – 50 nodes 450 ns mod 400 350 300 250 Packet Throughput (pkt/s) 200 150 100 50 0 0 5 10 15 20 25 30 35 40 45 50 Flow index
Model vs Sim – 50-nodes example 450 sim 400 model 350 300 250 Throughput (pkt/s) 200 150 100 50 0 0 10 20 30 40 50 Rank
Model vs Sim – 50-nodes example 1 sim 0.9 model 0.8 0.7 0.6 0.5 Packet Loss Probability 0.4 0.3 0.2 0.1 0 1 0.9 0.8 0.7 0.6 Fraction of busy time 0.5 0.4 0.3 0 5 10 15 20 25 30 35 40 45 50 Rank
1 0.9 0.8 0.7 0.6 0.5 0.4 0.3 0.2 0.1 0 1 0.9 0.8 0.7 0.6 0.5 0.4 0.3 0.2 0.1 0 Model vs Sim – 50-nodes example sim model Packet Loss Probability Fraction of busy time 0 5 10 15 20 25 30 35 40 45 50 Rank
B a A b Analysis of Asymmetric Incomplete State scenarios(AIS) A a B b • Flow A a does not know when to contend: it has to discover an available gap in the activity of flow B b randomly, where to place an entire RTS or DATA packet RTS/DATA ? A a … … B b B b B b B b t
Analysis of Asimmetric Incomplete State scenarios(AIS) A a B b B b B b A a B b B b B b A a B b B b B b • The collision probability of flow A a can be accurately computed assuming that the first packet arrives at a random point in time • The collision probability of flow B bis zero
Addressing Starvation • 3 approaches:(within family of random access protocols) • Structural approach : a slotted system with global synchronization (e.g. Slotted Aloha) eliminates starvation due to lack of coordination • Rate-limiting approach: sources are appropriately rate-limited to leave sufficient “air time” to flows subject to starvation • MAC-based approach:enhanced coordination mechanisms on top of existing MAC protocols: • receiver-initiated random access • schedule advertisement • orthogonal access
System comparison • It is essential to: • Consider how individual flows are treated in two different systems • Separate out unbalance due to topology (number of contenders) and starvation due to the MAC protocol • We take as reference system: Slotted Aloha • Starvation structurally eliminated • Attempt probabilities can be set to achieve proportional fairness: K. Kar, S. Sarkar, L. Tassiulas, Achieving Proportional Fair Rates using Local Information in Aloha Networks, IEEE Transactions on Automatic Control, Vol . 49, No. 10, October 2004
Lorentz curve and Gini index 1 Gini 802.11 = 0.76 0.8 Gini Aloha = 0.33 0.6 Fraction of aggregate throughput 0.4 802.11 0.2 Aloha prop fair ideal 0 1 5 10 15 20 25 30 35 40 45 50 top x flows
1 0.8 0.6 Fraction of aggregate throughput 0.4 0.2 0 5 10 15 20 25 30 35 40 45 50 top x flows Lorentz curve and Gini index Sx Range =Tx Range = 200 m Tx Range = 200 m Sx Range= 400 m 1 0.8 0.6 Fraction of aggregate throughput 0.4 802.11 802.11 0.2 Aloha prop fair Aloha prop fair 0 5 10 15 20 25 30 35 40 45 50 top x flows