Download
1 / 39
400 likes | 537 Views
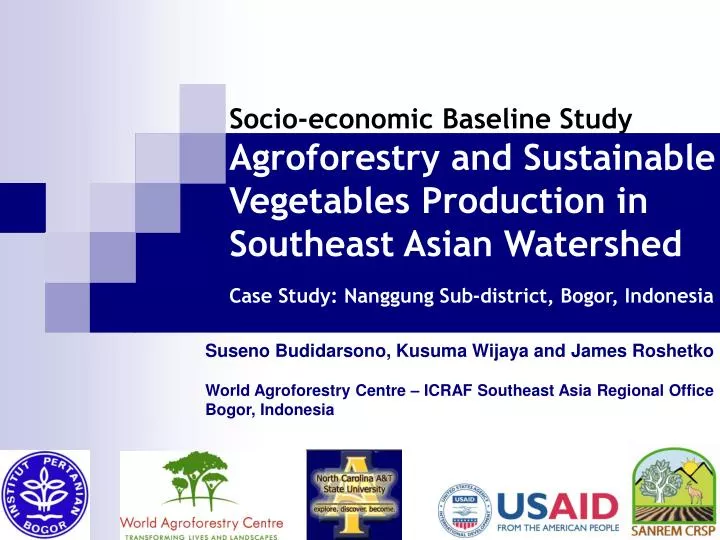
Socio-economic Baseline Study Agroforestry and Sustainable Vegetables Production in Southeast Asian Watershed. Suseno Budidarsono, Kusuma Wijaya and James Roshetko World Agroforestry Centre – ICRAF Southeast Asia Regional Office Bogor, Indonesia.

E N D
Socio-economic Baseline StudyAgroforestry and Sustainable Vegetables Production in Southeast Asian Watershed Suseno Budidarsono, Kusuma Wijaya and James Roshetko World Agroforestry Centre – ICRAF Southeast Asia Regional Office Bogor, Indonesia Case Study: Nanggung Sub-district, Bogor, Indonesia
Objective: Provide a socio-economic data as a basis for socio-economic impact assessment of integrated vegetable-agroforestry system
The scope of the study • Socio-economic data • Farm characteristics • Gender roles • Household income and consumption • Labor availability
The study site KECAMATAN NANGGUNG
Methods • Household Survey Multistage Random Sampling with Propotional Stratification • 3 Villages (Hambaro, Parakan Muncang, Sukaluyu village) • 4,302 inhabitants (22.3% of total sub-district) • 2,940 population of study (households who ‘controlling’ the land) • 185 households as respondent (households who practiced vegetable farming)
Methods Population and Sample Size
Findings • Physical characteristics • Socio Economic Characteristics • Land ‘Ownership’ • Farming System Characteristics
Socio Economic Characteristics Comparing with Province and National Data
Socio Economic Characteristics Household Income by Sources of Income
Socio Economic Characteristics Household Income by Sources of Income
Socio Economic Characteristics Household Expenditure
Socio Economic Characteristics Poverty Line
Land ‘Ownership’ Way Obtaining Land by Land Status
Farming System Characteristics Plot Characteristics
Farming System Characteristics Plot Characteristics
Farming System Characteristics Top Ten Vegetables Species Cultivated (% of plot number)
Farming System Characteristics Household experienced with Tree-annual crop Farming System
Farming System Characteristics Average Level of Labour Input by land use type (ps-day/ha/year)
Farming System Characteristics Labor inputs by land holding size and land use type
Farming System Characteristics Level of External Farm Inputs by type of land use type (% of plot)
Farming System Characteristics Level of External Farm Inputs by type of land use type (ps-day/ha/year)
Farming System Characteristics Farm income by Species cultivated (per ha)
Farming System Characteristics Marketable commodities and the marketing chain (in % by commodities)
Farming System Characteristics Average Level of Labour Input by land use type and gender (% plot)
Farming System Characteristics Average Level of Labour Input by land use type and gender (% plot)
Farming System Characteristics Who control the expenditure for Agricultural inputs
Concluding Remarks • The Kecamatan Nanggung includes 7,022.3 (63.8%) hectare of arable land. The remaining area is housing and other infrastructures and other uses . • Population growth (since 2003-2006) was 0.40% per year, lower than West Java Province and National growth. Population density of the area is 683 persons per square kilometers (ps.km-2), lower than for West Java. • 63.4% of working population (economically active population) engages in agriculture, higher than national data (46.3%). • Largest proportion of family income were spent on food (62%) • Agricultural income contributed 14% to the total households’ income. In Term the poverty line, the study found that 52% of the surveyed households are below poverty line, and thus are categorized as poor. • Unequal land distribution is a characteristic of the study site, where the bottom 60% of the surveyed household controlled only 15% of total landholding size, while the top 20% controlling about 62% of the total landholding size.
Concluding Remarks • Intensive agriculture (paddy field, dryland and monoculture garden) mostly takes place in the relatively flat area, more than 80% of the plots are considered by the respondents as gently to slightly steep area. • The top five vegetables species found in of plots samples were : Pisang (Musa sp.), Kacang panjang (Vigna sinensis), Timun (Trichosanthes cucumeroides maxim), Kucai (Allium tuberosum) and Buncis (Phaseolus vulgaris). This species mostly cultivated in dryland and simple agroforest. • Kacang panjang (Vigna sinensis), Timun (Trichosanthes cucumeroides maxim), Kucai (Allium tuberosum) and Buncis (Phaseolus vulgaris), are the most common annual crops cultivated by farmer under Dudukuhan system. • The number of ps-days involve in land preparation is much higher than in other activities. Number of ps-days involved in nursery activities and fertilizing activities is the lowest compare with the others activities. • The use fertilizer common in all sample plots in the study site, except for complex agroforests and fallow lands. The fertilizer rate of every land use category varies according to land use category and varies among plot within the land use category.
Concluding Remarks • Almost all commodities harvested in the plot were sold by the surveyed households. Most of the harvested yields (89% or more) are sold for 22 annual commodities. Only 76.5% of corn yields are sold and 29.6% of rice. All (100%) of the sawi produced is consumed by households. • Data recorded from the surveyed household shows that high value species (Cabe, Caesin, Kacang kedelai ) mosly sold directly through consumer, this show that farmers lack adequate market information and market access. • Women involved in agriculture is limited to certain activities, in paddy field, women had proportion more than 15% of labor input only in nursery, maintaining, fertilizing, and harvesting activities. But for others land use, proportion of women labor very small.