Download
1 / 23
230 likes | 396 Views
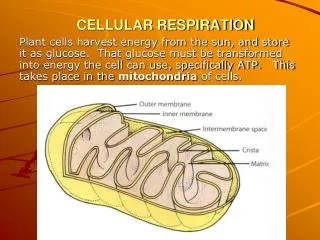
CELLULAR RESPIRATION part two. Sections 2.1 & 2.2 pg. 90 +. Stage 4: Electron Transport and Chemiosmosis. 10 NADH produced in Stages1-3 2 FADH 2 from Stage 3 NADH and FADH 2 transfer their electrons to the electron transport chain (ETC). The electron transport chain (ETC).

E N D
CELLULAR RESPIRATIONpart two Sections 2.1 & 2.2 pg. 90 +
Stage 4: Electron Transport and Chemiosmosis • 10 NADH produced in Stages1-3 • 2 FADH2 from Stage 3 NADH and FADH2 transfer their electrons to the electron transport chain (ETC)
The electron transport chain (ETC) • Series of proteins arranged along the inner membrane (the cristae) • Increasing negativity • Get a series of redox reactions
Free energy released with each redox • Oxygen is the final electron acceptor
ETC – the finer details • NADH passes 2 electrons to NADH dehydrogenase • Electrons are moved along the ETC
ETC – the finer details • Free E that is released is used to pump H+ from the matrix intermembrane space • For every pair of e-s, each protein pumps out one H+
ETC – the finer details • When oxygen is reduced, it also binds 2 H+, and forms one H2O (inside the matrix)
Chemiosmosis = ATP formation • Electrochemical (E.C.) gradient established across membrane by H+ • High [H+] in intermembrane space
Chemiosmosis = ATP formation • Proton-motive force drives H+ through an ATPase complex. Free energy released. • Drives phosphorylation of ADP ATP
Energy accounting One ATP formed for every H+ that moves in through ATPase For each pair of e-’s, one H+ is pumped in by each of the three stationary proteins in the ECT.
2 ATP for every FADH2 • FADH2 passes its e-’s to cytochrome b-c1 complex FADH2 FAD
NOTE: NADH produced in glycolysis can’t pass through membrane. Transfers its 2 electrons to FAD through a membrane protein FADH2
glycolysis2 NADH 2 FADH2 pyruv. ox. 2 NADH Krebs 6 NADH 2 FADH2 8 NADH 4 FADH2
Conversion (cashing out) 3 ATP per NADH: 3 ATP x 8 NADH = 24 ATP 2 ATP per FADH2 2 ATP x 4 FADH2 = 8 ATP = 32 ATP (ETC) + 4 ATP (glycol./Krebs) total 36 ATP
Conversion (cashing out) **Realistically** Each NADH produces 2.5 ATP Each FADH2 produces 1.5 ATP 2.5 ATP x 8 NADH = 20 ATP 1.5 ATP x 4 FADH2 = 6 ATP = 26 ATP (ETC) + 4 ATP glycol.&Krebs) total 30 ATP
Summary of process C6H12O6 + 6O2 6CO2 + 6H2O + energy • Glucose is oxidized to carbon dioxide. • Oxygen is reduced to water. • 36 molecules of ATP are produced. √ √ √
Efficiency • Approx. 32% efficiency of energy conversion
Metabolic rate • Metabolic rate – the rate at which cellular respiration takes place • Amount of energy consumed by an organism in a given time. • Basal metabolic rate (BMR) – minimum amount of energy needed to keep an organism alive • BMR = Kilojoules per square metre of body surface per hour • BMR = (kJ/m2)/hour • BSA – BODY SURFACE AREA • BSA = 0.007184m0.425h0.725 • SI unit: mass = kg, height = cm (study pg. 111)
BMR is usually higher for males than females • BMR is highest for a 1-y.o. infant. – decreases after that.
Homework pg. 115 #1-16 (skip 14)