Download

1 / 18
200 likes | 746 Views
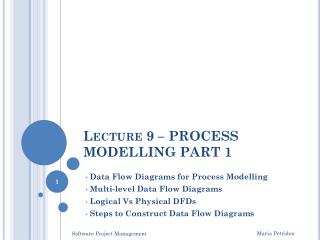
G045 Lecture 08 DFD Level 1 Diagrams (Data Flow Diagrams Level 1). Mr C Johnston ICT Teacher www.computechedu.co.uk. Session Objectives. Understand what a level 1 diagram shows, Know the common components of a level 1 diagram, Be able to draw level 1 diagrams for given scenarios,.

E N D
G045 Lecture 08DFD Level 1 Diagrams (Data Flow Diagrams Level 1) Mr C Johnston ICT Teacher www.computechedu.co.uk
Session Objectives • Understand what a level 1 diagram shows, • Know the common components of a level 1 diagram, • Be able to draw level 1 diagrams for given scenarios,
Level 1 Data Flow Diagrams • Level 1 diagrams expand the main box within the context diagram and show what happens to the data within the system • They are made up of external entities, data flows, processes and data stores, • They are drawn using a standard set of symbols • The data flowing into the system at level 1 must match the context diagram.
Level 1 DFD Components • External entities interact with the system (people etc) but not actually part of it – they put data into the system or receive from it. They are represented in an ellipse with their name clearly displayed • Data stores are where data is stored. Data can be written or read from a data store. On the diagram that have a sensible name and could be computerised or manual system such as filing cabinets • Data flows indicate the direction of information flowing around the system. They are labelled arrows with the head showing direction of flow. • Processes are activities which take place in the system – normally it involved some sort of transformation to the data and have at least one data input and output. Processes are numbered on the diagram in order and have a label which include a verb.
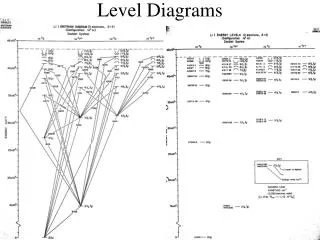
1 Add new customer Customer Customer Level 1 DFD Symbols External Entities – labelled with the name The ellipse with the slash across is used to repeat an entity later in the diagram to ensure its neat Processes – numbered and labelled with a verb Rectangle has number of process (this is in order which it happens) and a label which states the process – uses a verb M1 Customer File Data stores – labelled with a type, a number and the name Type is either M for manual or D for computerised store and the numbers counts up how many there are in the system Data Flows Arrow head shows the direction of the flow, should have a simple meaningful label describing the data
Drawing Diagrams • Start by reading a scenario and summarising what is going on into a table. Use the table drawn for the level 0 to help but notice this one has much more detail about the activities. • Activities become processes and documents used become data stores
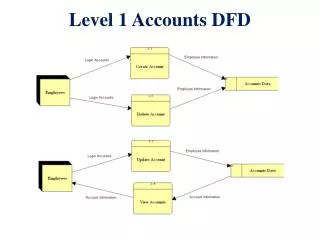
Example Reporting day data is complied by a system at Stringer. Staff enter grades into the system for each student which includes their ID, a current working at grade and effort for a subject. The system stores them, compares with past data and generates a grade report for parents. Summary information is also generated for year heads showing subject grades for each student in the year and one for form tutors summarising their tutees performance.
STAFF 1 Student ID, working grade and effort Student records retrieved from student database – new grades appended to grade database Student ID, subject ID, reporting day ID, working grade and effort Student ID STUDENT DB 2 D1 Grades Student Details New and old grades compared – comparison result appended to grade database working grade and effort STUDENT DB 3 Student ID working grade and effort PARENTS Student reporting day reports compiled Student Details Grade Information D1 Grades 4 YEAR HEAD working grade and effort Year group summary grades Summary reports produced grouping by year and tutor group STUDENT DB FORM TUTORS Student ID Tutor group summary grades Student Details grade comparison result
Summary • Read the scenario and work out the activities which go on within the system, • Draw the table listing the activities in order, what happens to the data and where it gets stored in the system, • Turn the table into a data flow diagram – • Activities become processes • Where the data is kept becomes data stores • Data flows connect the processes and data stores • Data enters and leaves the system to and from external entities • Check that the flows entering and exiting the system match what is on the level 0 diagram.
Exercises An insurance company system takes details from customers which includes personal, car and past claim data. The information acquired is complied and pasted onto an external broker which generates quotes. On return from the broker the best quote is formatted appropriately and sent to the customer. The university and college admission system (UCAS) handles applications to higher education by students in the UK. Students submit data to the system which includes personal details, estimated grades, courses and institutions they want to apply for and a personal statement. A tutor also submits a reference for each student into the system. The system compiles each students application and forwards it onto the institution applied for. Upon receipt the staff at the university scrutinise the application and return to UCAS an offer or rejection – this is then passed onto the student.
CUSTOMER 1 Personal, car and past claim data Collate customer details Collated customer details 2 D1 Customer File Send details to broker Collated details Broker details D2 Brokers quotes 3 BROKER Best quote selected and formatted and stored Formatted quotes Customer details D3 Quotes 4 quotes CUSTOMER Presented to the customer neatly Customer details Best quote D1 Customer File
STUDENT 1 Application Compiled Personal data, est. grades, courses, institution data and personal statement Complied Applications TUTOR Reference 2 D1 Applications Applications forwarded to institutions and status updated INSTIUTION Application Applicant Information Contact details D2 Institutions Response to application 3 Application status updated Status D1 Applications 4 Application with decision STUDENT Offer / Rejection letter compiled and sent Contact details Offer / rejection D2 Institutions Status update
Further Exercise Download the exercises below and read the instructions carefully – draw the L1 diagrams as required. • Further Exercise 1
STUDENT STAFF Student details Book details Reservation of Book Complete loan and mark book available D Students D Books Return Book Details Loan Reservation Loan details Reservations D Loans D Reservation Book details D Books Book marked available
Loan details Student details Book details D Loans Check for overdue books and calculate how overdue Generate Reminder Generate monthly reminder Calculate Fine, Generate Bill and Produce weekly staff report D Books D Students Over due >7 days Fine Values D Fines Billing letter Monthly list of students req Reminder Billed Over dues Tutor Library Staff Student Over due < 7 days D Tutors Over due >21 days Tutor Details
More Practice Spilt into pairs and develop a small scenario and solution which a L1 diagram could be drawn for. You will need to draw a L0 / Context diagram to help another pair draw their diagram. Give you problem to another pair and ask them to draw a diagram before marking it and giving them the answer.
Assignment Link By next lesson draw a level 1 diagram for KASBAH NEWS’ Current System. Start by drawing a table to identify all the activities which go on, where the data is stored and when it enters and exits the system. Ensure you describe exactly what happens during each process - including any calculations, sorts and searches with the data, Ensure it matches you level 0 diagram before handing it in.
Task E What to Hand In Level 0 / Context Diagram Table Describing External Entities Table Describing the data flows Level 1 Table used to construct the diagram (See slide 6) Diagram Table describing external entities Description of the data stores (format / what stored) Description of each process – what goes on