Download
1 / 49
500 likes | 648 Views
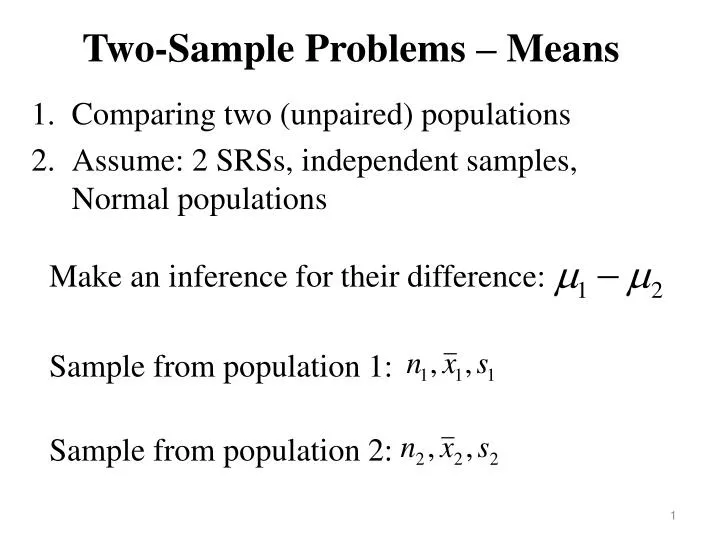
Two-Sample Problems – Means. Comparing two (unpaired) populations Assume: 2 SRSs, independent samples, Normal populations. Make an inference for their difference:. Sample from population 1:. Sample from population 2:. S.E. – standard error in the two-sample process. Confidence Interval:.

E N D
Two-Sample Problems – Means • Comparing two (unpaired) populations • Assume: 2 SRSs, independent samples, Normal populations • Make an inference for their difference: • Sample from population 1: • Sample from population 2:
S.E. – standard error in the two-sample process • Confidence Interval: • Estimate ± margin of error • Significance Test:
Using the Calculator • Confidence Interval: • On calculator: STAT, TESTS, 0:2-SampTInt… • Given data, need to enter: Lists locations, C-Level • Given stats, need to enter, for each sample: x, s, n • and then C-Level • Select input (Data or Stats), enter appropriate info, then Calculate
Using the Calculator • Significance Test: • On calculator: STAT, TESTS, 4:2-SampT –Test… • Given data, need to enter: Lists locations, Ha • Given stats, need to enter, for each sample : x, s, n • and then Ha • Select input (Data or Stats), enter appropriate info, then Calculate or Draw • Output: Test stat, p-value
Model 1: Ex 1. Is one model of camp stove any different at boiling water than another at the 5% significance level? • Model 2:
Children: Ex 2. Is there evidence that children get more REM sleep than adults at the 1% significance level? • Adults:
Iris virginica: Ex 3. Create a 98% C.I for estimating the mean difference in petal lengths (in cm) for two species of iris. • Iris setosa:
Iris virginica: Ex 4. Is one species of iris any different at petal length than another at the 2% significance level? • Iris setosa: 0 2 3 -3 -4 -1 4 -2 1
Two-Sample Problems – Proportions • Make an inference for their difference: • Sample from population 1: • Sample from population 2:
Using the Calculator • Confidence Interval: • Estimate ± margin of error • On calculator: STAT, TESTS, B:2-PropZInt… • Need to enter: C-Level • Enter appropriate info, then Calculate.
Using the Calculator • Significance Test: • On calculator: STAT, TESTS, 6:2-PropZTest… • Need to enter: and then Ha • Enter appropriate info, then Calculate or Draw • Output: Test stat, p-value
Nesting boxes apart/hidden: Ex 5. Create a 95% C.I for the difference in proportions of eggs hatched. • Nesting boxes close/visible:
Ex 6. Split 1100 potential voters into two groups, those who get a reminder to register and those who do not. Of the 600 who got reminders, 332 registered. Of the 500 who got no reminders, 248 registered. Is there evidence at the 1% significance level that the proportion of potential voters who registered was greater than in the group that received reminders? • Group 1: • Group 2:
Ex 7. “Can people be trusted?” Among 250 18-25 year olds, 45 said “yes”. Among 280 35-45 year olds, 72 said “yes”. Does this indicate that the proportion of trusting people is higher in the older population? Use a significance level of α = .05. • Group 1: • Group 2:
Scatterplots & Correlation Each individual in the population/sample will have two characteristics looked at, instead of one. Goal: able to make accurate predictions for one variable in terms of another variable based on a data set of paired values.
Variables • Explanatory (independent) variable, x, is used to • predict a response. • Response (dependent) variable, y, will be the • outcome from a study or experiment. • height vs. weight, • age vs. memory, • temperature vs. sales
Scatterplots • Plot of paired values helps to determine if a relationship exists. • Ex: variables – height(in), weight (lb) 190 170 150 65 66 70 72 68
Scatterplots - Features • Direction: negative, positive • Form: line, parabola, wave(sine) • Strength: how close to following a pattern • Direction: 190 • Form: 170 • Strength: 150 65 66 70 72
Scatterplots – Temp vs Oil used • Direction: 45 • Form: 35 • Strength: 25 20 30 70 90
Correlation • Correlation, r, measures the strength of the linear relationship between two variables. • r > 0: positive direction • r < 0: negative direction • Close to +1: • Close to -1: • Close to 0:
Lines - Review • y = a + bx 3 • a: 2 1 1 2 • b: 3 4
Regression Looking at a scatterplot, if form seems linear, then use a linear model or regression line to describe how a response variable y changes as an explanatory variable changes. Regression models are often used to predict the value of a response variable for a given explanatory variable.
Least-Squares Regression Line • The line that best fits the data: • where:
Example • Fat and calories for 11 fast food chicken sandwiches • Fat: • Calories:
Example • Fat and calories for 11 fast food chicken sandwiches • Fat: • Calories: Calories Fat
Example-continued • What is the slope and what does it mean? • What is the intercept and what does it mean? • How many calories would you predict a sandwich with 40 grams of fat has?
Why “Least-squares”? • The least-squares lines is the line that minimizes • the sum of the squared residuals. • Residual: difference between actual and predicted 27 18 9 1 3
Scatterplots – Residuals • To double-check the appropriateness of using a linear regression model, plot residuals against the explanatory variable. • No unusual patterns means good linear relationship.
Other things to look for • Squared correlation, r2, give the percent of variation explained by the regression line. • Chicken data:
Other things to look for • Influential observations: • Prediction vs. Causation: • x and y are linked (associated) somehow but • we don’t say “x causes y to occur”. Other forces may be causing the relationship (lurking variables).
Extrapolation: using the regression for a prediction outside of the range of values for the explanatory variables.
On calculator • Set up: 2nd 0(catalog), x-1(D), scroll down to • “Diagnostic On”, Enter, Enter • Scatterplots: 2nd Y=(Stat Plot), 1, On, Select Type • And list locations for x values and y values • Then, ZOOM, 9(Zoom Stat) • Regression: STAT, CALC, 8: LinReg (a + bx), enter, • List location for x, list location for y, enter • Graph: Y=, enter line into Y1
Contingency Tables Making comparisons between two categorical variables • Contingency tables summarize all outcomes • Row variable: one row for each possible value • Column variable: one column for each possible value • Each cell (i,j) describes number of individuals with those values for the respective variables.
Info from the table • # who are over 25 and make under $15,000: • % who are over 25 and make under $15,000: • % who are over 25: • % of the over 25 who make under $15,000:
Marginal Distributions • Look to margins of tables for individual variable’s distribution • Marginal distribution for age: • Marginal distribution for income:
Conditional Distributions • Look at one variable’s distribution given another • How does income vary over the different age groups? • Consider each age group as a separate population and compute relative frequencies:
Independence Revisited • Two variables are independent if knowledge of one • does not affect the chances of the other. • In terms of contingency tables, this means that the • conditional distribution of one variable is (almost) the • same for all values of the other variable. • In the age/income example, the conditionals are not • even close. These variables are not independent. • There is some association between age and income.
Test for Independence Is there an association between two variable? • H0: The variables are ( The two variables are ) • Ha: The variables (The two variables are ) Assuming independence: • Expected number in each cell (i, j): • (% of value i for variable 1)x(% of j value for variable 2)x (sample size) =
Example of Computing Expected Values Expected number in cell (A, +):
Chi-square statistic To measure the difference between the observed table and the expected table, we use the chi-square test statistic: where the summation occurs for each cell in the table. Skewed right df = (r – 1)(c – 1) Right-tailed test
Test for Independence – Steps • State variables being tested • State hypotheses: H0, the null hypothesis, vars independent • Ha, the alternative, vars not independent • Compute test statistic: if the null hypothesis is true, where • does the sample fall? Test stat = X2-score • Compute p-value: what is the probability of seeing a test stat • as extreme (or more extreme) as that? • Conclusion: small p-values lead to strong evidence against H0.
ST – on the calculator • On calculator: STAT, TESTS, C:X2 –Test • Observed: [A] • Expected: [B] • Enter observed info into matrix A, then perform test with Calculate or Draw. • To enter observed info into matrix A: • 2nd, x-1 (Matrix), EDIT, 1: A, change dimensions, enter info in each cell. • Output: Test stat, p-value, df
Ex . Test whether type and rh factor are independent at a 5% significance level.
Ex . Test whether age and stance on marijuana legalization are associated.