Download
1 / 57
570 likes | 703 Views
Rutherford Appleton Seminar 19 March 2008. Is the search for the origin of the Highest Energy Cosmic Rays over? Alan Watson University of Leeds, England a.a.watson@leeds.ac.uk. OVERVIEW Why there is interest in cosmic rays > 10 19 eV

E N D
Rutherford Appleton Seminar 19 March 2008 Is the search for the origin of the Highest Energy Cosmic Rays over? Alan Watson University of Leeds, England a.a.watson@leeds.ac.uk
OVERVIEW • Why there is interest in cosmic rays > 1019 eV • The Auger Observatory • Description and discussion of measurements:- • Energy Spectrum • Arrival Directions • Primary Mass • Prospects for the future
Knee Ankle air-showers >1019 eV 1 km-2 sr-1 year-1 after Gaisser
Why the Interest? (i) Can there be a cosmic ray astronomy? Searches for Anisotropy (find the origin) Deflections in magnetic fields: at ~ 1019 eV: ~ 2 - 3° in Galactic magnetic field for protons - depending on the direction For interpretation, and to deduce B-fields, ideally we need to know Z - hard enough to find A! History of withdrawn or disproved claims
(ii)What can be learned from the spectrum shape? • ‘ankle’ at ~ 3x10¹⁸ eV • - galactic/extra-galactic transition? • Steepening above 5 x 10¹⁹ eV because of energy losses? • Greisen-Zatsepin-Kuz’min – GZK effect (1966) • γ2.7 K+ p Δ+ n + π+ or p + πo • (sources of photons and neutrinos) • or • γIR/2.7 K+ A (A – 1) + n(IR background more uncertain)
(iii) How are the particles accelerated? • Synchrotron Acceleration (as at CERN) • Emax = ZeBRc • Single Shot Acceleration (possibly in pulsars) • Emax = ZeBRc • Diffusive Shock Acceleration at shocks • Emax = kZeBRc, with k<1 • Shocks in AGNs, near Black Holes, Colliding Galaxies ……
Hillas 1984 ARA&A B vs R Magnetars? GRBs?
Existence of particles above GZK-steepening would imply that sources are nearby, 70 – 100 Mpc, depending on energy. IF particles are protons, the deflections are small enough above ~ 5 x 10¹⁹ eV that point sources might be seen So, measure: - energy spectrum - arrival direction distribution - mass composition But rate at 1020 eV is < 1 per km2 per century - and we don’t know the relevant hadronic physics
1.3 cm Pb Shower initiated by proton in lead plates of cloud chamber Fretter: Echo Lake, 1949
The p-p total cross-section LHC measurement of sTOT expected to be at the 1% level – very useful in the extrapolation up to UHECR energies 10% difference in measurements of Tevatron Expts: (log s) James L. Pinfold IVECHRI 2006 14
LHC Forward Physics & Cosmic Rays Models describe Tevatron data well - but LHC model predictions reveal large discrepancies in extrapolation. ET (LHC) E(LHC) James L. Pinfold IVECHRI 2006 13
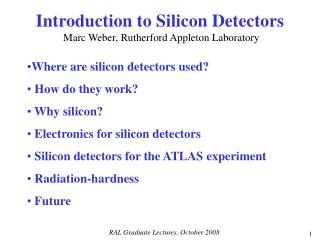
LHCf: an LHC Experiment for Astroparticle Physics LHCf: measurement of photons and neutral pions and neutrons in the very forward region of LHC Add an EM calorimeter at 140 m from the Interaction Point (IP1 ATLAS) For low luminosity running
The Pierre Auger Collaboration Aim: To measure properties of UHECR with unprecedented statistics and precision – first discussions in 1991
Shower Detection Methods The design of the Pierre Auger Observatory marries the two well-established techniques the ‘HYBRID’ technique Nitrogen fluorescence as at Fly’s Eye and HiRes Fluorescence → OR AND Array of water- → Cherenkov detectors or Scintillation Counters 11
26 February 2008 • Surface Array 18 March 2008) • 1627 surface detector tank assemblies deployed • 1603 surface detector stations with water • 1526 surface detector stations have electronics
GPS Receiver and radio transmission
Typical flash ADC trace at about 2 km Detector signal (VEM) vs time (µs) Lateral density distribution PMT 1 PMT 2 PMT 3 θ~ 48º, ~ 70 EeV 18 detectors triggered Flash ADC traces Flash ADC traces -0.5 0 0.5 1.0 1.5 2.0 2.5 3.0 µs
Schmidt Telescope using 11 m2 mirrors UV optical filter (also: provide protection from outside dust) Camera with 440 PMTs (Photonis XP 3062)
FD reconstruction Signal and timing Direction & energy Pixel geometry shower-detector plane
The essence of the hybrid approach Preciseshower geometryfrom degeneracy given by SD timing Essential step towards high quality energy and Xmax resolution Times at angles, χ, are key to finding Rp
Angular Resolution from Central Laser Facility 355 nm, frequency tripled, YAG laser, giving < 7 mJ per pulse: GZK energy Mono/hybrid rms 1.0°/0.18°
1.17 1.07
Results from Pierre Auger Observatory Data taking started on 1 January 2004 with 125 (of 1600) water tanks 6 (of 24) fluorescence detectors more or less continuous since then ~ 1.3 Auger years to 31 Aug 2007 for anisotropy ~ 1 Auger year for spectrum analysis
Zenith angle ~ 48º Energy ~ 70 EeV Energy Determination with Auger The energy scale is determined from the data and does not depend on a knowledge of interaction models or of the primary composition – except at level of few %. The detector signal at 1000 m from the shower core – S(1000) - determined for each surface detector event S(1000)is proportional to the primary energy
S38 (1000)vs. E(FD) 5.6 x 10¹⁹ eV 661 Hybrid Events Energy from Fluorescence Detector
Note: Activity on several fronts to reduce these uncertainties Summary of systematic uncertainties Fluorescence Detector Uncertainties Dominate
Energy Spectrum from Surface Detectors θ < 60° Slope = - 2.68 ± 0.02 ± 0.06 Exp Obs > 4 x 10¹⁹ eV 179 ± 9 75 > 1020 eV 38 ± 3 1 Could we be missing events? Calibration unc. 19% FD system. 22% - 4.0 ± 0.4 7000 km2 sr yr ~ 1 Auger year ~ 20,000 events
Evidence that we do not miss events with high multiplicity = 79 ° Inclined Events offer additional aperture of ~ 29% to 80°
AGASA: Surface Detectors: Scintillators over 100 km2 Energy Estimates are model and mass dependent Recent reanalysis has reduced number > 1020 eV to 6 events Takeda et al. ApP 2003
Summary of Inferences on Spectrum • Clear Evidence of Suppression of Flux > 4 x 10¹⁹ eV • Rough agreement with HiRes at highest energies • (Auger statistics are superior) • - but is it the GZK-effect (mass, recovery)? • AGASA result not confirmed • AGASA flux higher by about 2.5 at 1019 eV • Excess over GZK above 1020 eV not found • Some – but few (~1 with Auger) - events above 1020 eV • Only a few per millenium per km2 above 1020 eV
Searching for Anisotropies • We have made targeted searches of claims by others • - no confirmations (Galactic Centre, BL Lacs) • There are no strong predictions of sources • (though there have been very many) • So:- • Take given set of data and search exhaustively • Seal the ‘prescription’ and look with new data • At the highest energies we think we have • observed a significant signal
Using Veron-Cetty AGN catalogue First scan gave ψ < 3.1°, z < 0.018 (75 Mpc) and E > 56 EeV 6 of 8 ‘misses’ are with 12° of galactic plane
Science: 9 November 2007 First scan gave ψ < 3.1°, z < 0.018 (75 Mpc) and E > 56 EeV
Support for BSS-S model from Han, Lyne, Manchester et al (2006)
Conclusions from ~ 1 year of data (as if full instrument) • There is a suppression of the CR flux above 4 x 10¹⁹ eV • The 27 events above 57 EeV are not uniformly distributed • Events are associated with AGNs, from the Veron-Cetty • catalogue, within 3.1° and 75 Mpc. This association has been • demonstrated using an independent set of data with a probability of • ~1.7 x 10⁻³ that it arises by chance ( ~1/600) • Interpretation: • The highest energy cosmic rays are extra-galactic • The GZK-effect has probably been demonstrated • There are > 60 sources (from doubles ~ 4 x 10⁻⁵ Mpc-3) • The primaries are possibly mainly protons with energies • ~ 30 CMS-energy at LHC. BUT
How we try to infer the variation of mass with energy photons < 2% above 10 EeV Xmax protons Data Fe Energy per nucleon is crucial Energy
Xup – Xdown chosen large enough to detect most of distribution
326 111 69 25 12 426 Large number of events allows good control and understanding of systematics
Elongation Rate measured over two decades of energy Partilce Physics Correct? Fluctuations in Xmax to be exploited