Download

1 / 21
210 likes | 335 Views
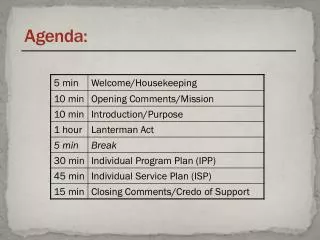
AGENDA:. Thurs --- DG10 10 minutes Thurs --- Notes Section 4.2 Fri --- DG11, Notes Section 4.3 Mon --- Media Center Tues --- Quiz 4 Thurs --- Test Ch 4. Advanced Placement Statistics Section 4.2: Relationships Between Categorical Variables.

E N D
AGENDA: • Thurs --- DG10 10 minutes • Thurs --- Notes Section 4.2 • Fri --- DG11, Notes Section 4.3 • Mon --- Media Center • Tues --- Quiz 4 • Thurs --- Test Ch 4
Advanced Placement Statistics Section 4.2: Relationships Between Categorical Variables EQ: How do you use a two-way table to determine relationships between 2 categorical (qualitative) variables?
Recall:Relationships Between Two Quantitative Variables • Scatterplots • Association • Regression
Relationships Between Two Qualitative Variables Contingency Tables
Terms To Know: • Marginal Totals --- counts for each row and column
Terms To Know: • Marginal Totals --- counts for each row and column • Marginal Distributions • --- percent for each row and column
Terms To Know: • Marginal Totals --- counts for each row and column • Marginal Distributions • --- percent for each row and column • Joint Distributions --- percent involving more thanone variable
Terms To Know: • Marginal Totals --- counts for each row and column • Marginal Distributions • --- percent for each row and column • Joint Distributions --- percent involving more thanone variable • Conditional Distributions • ---percent for one variable • across some condition on the other variable
Now answer the questions on your notes. • What is the probability a person responded they felt under stress? • What is the probability that a person responded they felt under stress and had reflux? • What is the probability that a person with reflux responded they felt under stress? • What is the probability that a person under stress responded they had reflux?
The following two-way table reports data on all undergraduate students enrolled in U.S. colleges and universities in the fall of 1995 whose age was known. 1. Calculate the marginal totals. Place them in the table. 2. How many undergraduate students were enrolled in colleges and universities? 14,117,000
3. What percent of the undergraduate students were 18 to 24 years old in the fall of the academic year? 7771 out of 14117 = 55.1% 4. Find the percent of undergraduates enrolled in each of the four types of program who were 18 to 24 years old. Make a bar graph to compare the programs. The 18 to 24 group is the traditional age for college students. Briefly summarize what you have learned from the data about the extent to which this group predominates in different kinds of college programs.
.6 .5 .4 .3 .2 .1 2 yr. 2 yr. 4 yr. 4 yr. Parttime Fulltime Partime Fulltime Type of College Program
More than half, 59%, of all 18 to 24 year olds are enrolled in 4 yr. colleges full time. • Almost twice as many 18 to 24 year olds, attend 2 yr. colleges part time, as those who attend 4 yr. colleges part time, 15% to 8% respectively.
An association of two-year colleges asks: “What percent of students enrolled part-time at 2-year colleges are 25 to 39 years old?” 1427 out of 3473 = 41% • 6. A bank that makes education loans to adults asks: “What percent of all 25- to 39- year-old students are enrolled part-time at 2-year colleges?” 1427 out of 4388 = 33%
Create a contingency table relating the conditional distributions of college program given age. 41/286 = 14% 125/286 = 44% 75/286 = 26% 45/286 = 16% 1378/7771 = 18% 1198/7771 = 15% 4607/7771 = 59% 588/7771 = 8% 428/4388 = 10% 1427/4388 = 33% 1212/4388 = 28% 1321/4388 = 30% 119/1672 = 7% 723/1672 = 43% 225/1672 = 14% 605/1672 = 36% • Remember, no single graph portrays the form of the relationship. And no single numerical measure summarizes the strength of the association.
ASSIGNMENT: p. 298 - 299 #23 – 26 p. 303 #31 – 34