Download
1 / 20
200 likes | 315 Views
Documenting an experiment: IMRD. 1.0 Introduction 2.0 Methods 3.0 Results 4.0 Discussion.

E N D
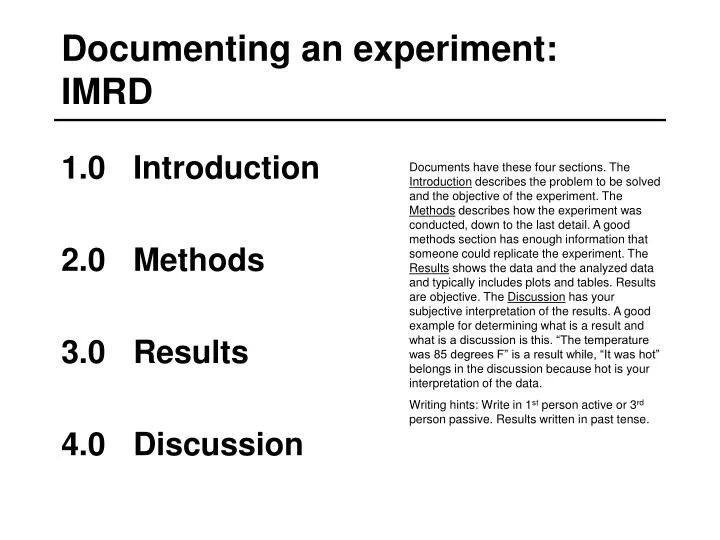
Documenting an experiment:IMRD 1.0 Introduction 2.0 Methods 3.0 Results 4.0 Discussion Documents have these four sections. The Introduction describes the problem to be solved and the objective of the experiment. The Methods describes how the experiment was conducted, down to the last detail. A good methods section has enough information that someone could replicate the experiment. The Results shows the data and the analyzed data and typically includes plots and tables. Results are objective. The Discussion has your subjective interpretation of the results. A good example for determining what is a result and what is a discussion is this. “The temperature was 85 degrees F” is a result while, “It was hot” belongs in the discussion because hot is your interpretation of the data. Writing hints: Write in 1st person active or 3rd person passive. Results written in past tense.
A good document has... • Title • Meaningful and descriptive • Authors, affiliation, date • Citations A non-descriptive title is “The beam experiment.” A descriptive title is “Experimentally Determined Elastic Modulus of a Yardstick.” Citations are very important. If you use an equation or include a figure, cite the source of the equation or figure. The rule is that without a cite, you drew the figure or took the photograph or you derived the equation.
A good document has…. • Clear, simple writing • No jargon • Just the right amount of information • Meaning to the reader • Pictures and graphics where appropriate • Meaningful data plots • No spelling, grammatical errors, typos
I wrapped the tape around the four legs of my dining room table. I counted 133 wraps plus some left over so that meant the tape was 812 ft. long. Example of a poor methods section for an experiment whose objective was to find the length of a video tape. The description does not have sufficient details to replicate the methods.
I measured the distance around the four legs of my dining room table. To measure the distance, I wrapped a string around the legs, then laid the string tight on a 25 ft. carpenters tape. The distance was 6 ft. 1 in. (to the nearest inch) I then wrapped the video tape around the legs and counted 133 complete wraps plus three feet of tape left over. The total tape length was therefore (133 x 6.083) + 3 = 812 ft. I believe this number is accurate to +- 1.0 ft. Example of a good methods section. Lots of details and includes estimates of accuracy.
How To Cite • For credibility, must cite sources • Common knowledge need not be cited • “Water is wet” • Special knowledge must be cited • “There are 780,000 new cases of stroke each year in the U.S.
Information Sources to Cite • Academic journal and conference papers • Text books • Trade magazine articles • Catalogs and data sheets • Manufacturer web sites • Government web sites
CitationSuggestions • Use accepted style (ASME, APA, Harvard,…) • Use RefWorks or EndNote or Zotero to manage citations • Resources at UMN library and elsewhere • RefWorks www.lib.umn.edu/site/refworks.phtml • Tutorial by UMN libraryhttp://tutorial.lib.umn.edu/infomachineb5bb.html?moduleID=10 • Durfee lab engineering writing pagehttp://www.me.umn.edu/labs/hmd/lab/writing.html
Data plots • Understand objectives • Pick the right data set • Pick the best plot format • Format and style • Data dominates • Label axes, quantity (units) • Descriptive title
Read these classic books for another take on presenting data.
Be Honest and Keep It Simple • Chart must reflect data accurately • Watch out for “Lie Factor” • (size of graphic effect)/(size of data effect) • Focus on data • Avoid “chartjunk” (Tufte)
A confusing figure because the dollars come in chunks but the scale is uniform. Plus y-axis anchor is not zero.
Tables make it hard to find the data. Good for appendices but not for the main body or for presentations.
A chart is better. This chart has unnecessary color and 3-D. All you see is the color, not the data.
This is a good chart. The title tells the story and the data is clear of “chartjunk”
. . . . . . . FAT DOTS ! 0.1% precision 5% precision Make sure the reader can see the data.
tie points fit model Curved lines are fine if you are fitting the data to a model. If the purpose is simply to tie points together, use straight lines.
Lab Report Style Guide http://me.umn.edu/education/undergraduate/writing.shtml