Download
1 / 11
120 likes | 406 Views
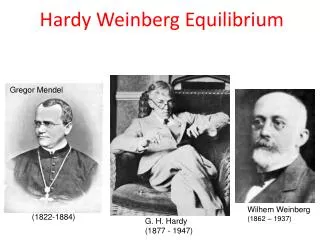
Hardy-Weinberg Equilibrium Review. By Sean McGrath. Hardy-Weinberg Theorem. Laid out in 1908 by the two scientists who independently discovered it States that frequencies of alleles within a population that is not evolving will remain constant from generation from generation

E N D
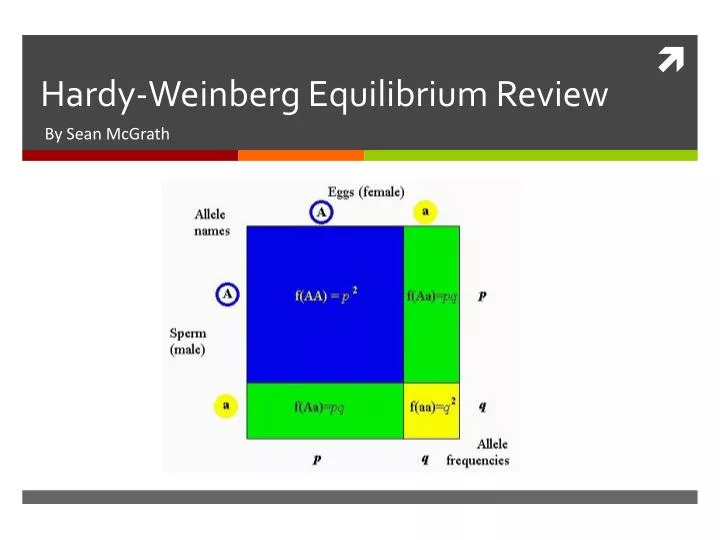
Hardy-Weinberg Equilibrium Review By Sean McGrath
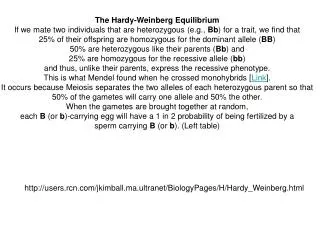
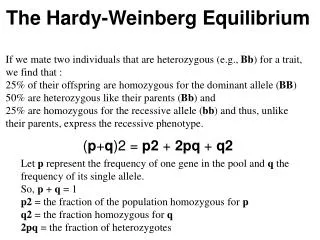
Hardy-Weinberg Theorem • Laid out in 1908 by the two scientists who independently discovered it • States that frequencies of alleles within a population that is not evolving will remain constant from generation from generation • Certain improbable conditions must be fulfilled in order for this Theorem to apply
Conditions of the Theorem • Extremely Large Population Size: As population size decreases, there are greater chance fluctuations in allele frequencies (genetic drift) • No Gene Flow: Transfer of alleles between populations cannot occur • No Mutations: Introducing or removing genes form chromosomes will modify gene pool • Random Mating: Preferential mating based on certain genotypes will not allow random mixing of gametes • No Natural Selection!: Differential survival and reproductive success alters allele frequencies
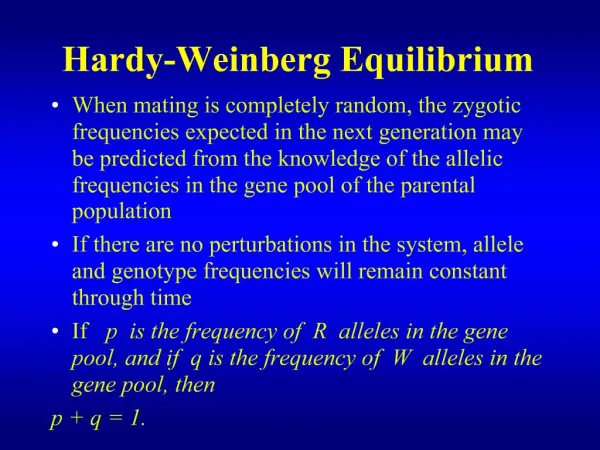
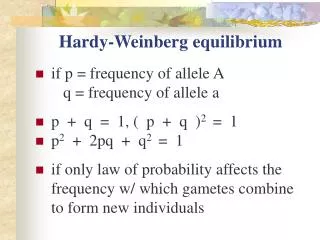
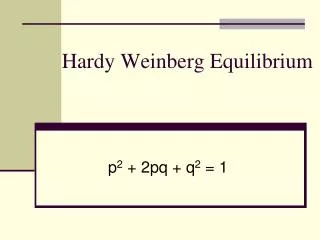
Hardy-Weinberg Equilibrium • The Theorem can be used to calculate expected Genotype frequencies, based on Allele frequencies within the population, and vice versa • When ‘p’ represents the dominant allele’s frequency, and ‘q’ represents the recessive allele’s frequency, then p+q=1 • When two haploid gametophytes merge, each with one copy of gene, the resulting genotype frequencies can be calculated based on (p+q)2 =12, or p2+2pq+q2=1 • Thus p2=Homozygous Dominant Individuals, 2pq=Heterozygous Individuals, and q2=Homozygous Recessive Individuals.
Example 1 • A population of velociraptors has two alleles for color, the dominant allele is for purple scales, while the recessive allele is for green scales. • If the purple allele has a frequency of .3, what is the frequency of the green scale allele? • p+q=1 p=.3 .3+q=1 q=1-.3 q=.7 • Thus, the frequency of the green allele is .7
Example 2 • In a population of sweaters, one allele codes for stripes, while the other allele codes for a plaid pattern. • The plaid allele is dominant, with a frequency of .8 • What is the frequency of the recessive genotype? (striped sweaters) • If p=.8, then q=.2 • The frequency of the Recessive Genotype=q2 • .22=.04, thus the frequency of the recessive genotype is .04
Example 3 • In a population of horses, there are brown horses and black horses. If the brown allele is recessive with an allelic frequency of .7, what is the frequency of the black phenotype? • If q=.7, then we can calculate that p=.3 • ‘p2’ gives us the Homozygous Dominant genotype and Dominant phenotype, but ‘2pq’ also displays the Dominant genotype despite being Heterozygous. • p2=.33=.09 2pq=2×.3×.7=.42 • p2+2pq=.09+.42=.51 Black Colored Phenotype
Switching it Up • So far, the examples have been used to calculate genotype frequencies based on allele frequencies. • In real life scenarios, often only the phenotypes may be observed, and we can work backwards to calculate allelic frequencies • These methods are often used to estimate percentages of the population carrying alleles for inherited diseases
Example 4 • In a population of cats, brown eyes are dominant and blue are recessive. 36% of the cats in the population display blue eyes • What are the allelic frequencies within the population? • 36% (.36) represents the Homozygous Recessive frequency or q2. To find q, we take the square root of .36 • √.36 =.6 if q (recessive frequency)=.6, then p must =.4 (remember, p+q=1
Example 5 • In a population of lab mice, brown fur is dominant, while white is recessive. 57.75% of the mice are brown. • What are the allelic frequencies within the population? • If .5775 = the frequency of the dominant phenotype (p2+2pq) then we can substitute this into the genotypic frequency equation, resulting in .5775+q2=1 • Subtracting, we find q2=.4225 • √q2=√.4225, q=.65 • The allelic frequency of white fur is .65, thus the frequency of the allele for brown fur is .35
You’re Now a Hardy-Weinberg Expert • Remember…the Hardy-Weinberg Theorem describes a hypothetical population that is not evolving, while in real populations allele and genotype frequencies change over time • Departure from the strict Hardy-Weinberg conditions often causes evolution • However, many populations evolve so slowly that for the most part they display near-equilibrium. In these cases, the Theorem may be applied.