Download
1 / 63
731 likes | 1.14k Views
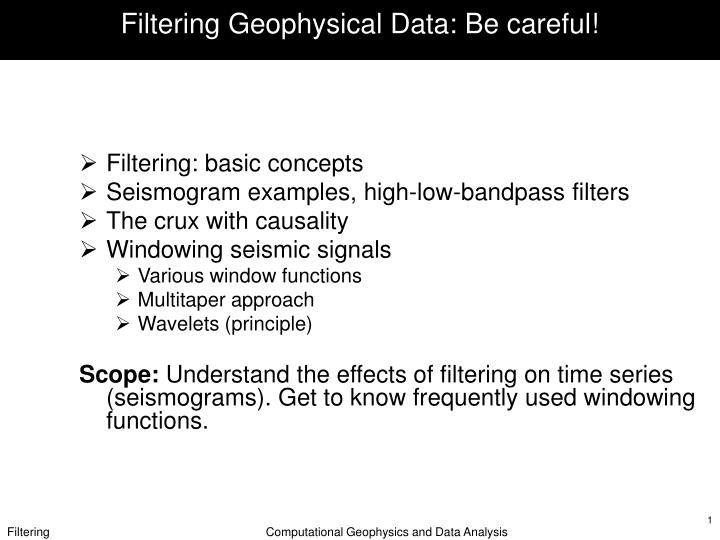
Filtering Geophysical Data: Be careful!. Filtering: basic concepts Seismogram examples, high-low-bandpass filters The crux with causality Windowing seismic signals Various window functions Multitaper approach Wavelets (principle)

E N D
Filtering Geophysical Data: Be careful! • Filtering: basic concepts • Seismogram examples, high-low-bandpass filters • The crux with causality • Windowing seismic signals • Various window functions • Multitaper approach • Wavelets (principle) Scope: Understand the effects of filtering on time series (seismograms). Get to know frequently used windowing functions. Computational Geophysics and Data Analysis
Why filtering • Get rid of unwanted frequencies • Highlight signals of certain frequencies • Identify harmonic signals in the data • Correcting for phase or amplitude characteristics of instruments • Prepare for down-sampling • Avoid aliasing effects Computational Geophysics and Data Analysis
A seismogram Amplitude Time (s) Spectral amplitude Frequency (Hz) Computational Geophysics and Data Analysis
Digital Filtering • Often a recorded signal contains a lot of information that we are not interested in (noise). To get rid of this noise we can apply a filter in the frequency domain. • The most important filters are: • High pass: cuts out low frequencies • Low pass: cuts out high frequencies • Band pass: cuts out both high and low frequencies and leaves a band of frequencies • Band reject: cuts out certain frequency band and leaves all other frequencies Computational Geophysics and Data Analysis
Cutoff frequency Computational Geophysics and Data Analysis
Cut-off and slopes in spectra Computational Geophysics and Data Analysis
Digital Filtering Computational Geophysics and Data Analysis
Low-pass filtering Computational Geophysics and Data Analysis
Lowpass filtering Computational Geophysics and Data Analysis
High-pass filter Computational Geophysics and Data Analysis
Band-pass filter Computational Geophysics and Data Analysis
The simplemost filter The simplemost filter gets rid of all frequencies above a certain cut-off frequency (low-pass), „box-car“ Computational Geophysics and Data Analysis
The simplemost filter … and its brother … (high-pass) Computational Geophysics and Data Analysis
… let‘s look at the consequencse … but what does H(w) look like in the time domain … remember the convolution theorem? Computational Geophysics and Data Analysis
… surprise … Computational Geophysics and Data Analysis
Zero phase and causal filters Zero phase filters can be realised by • Convolve first with a chosen filter • Time reverse the original filter and convolve again • First operation multiplies by F(w), the 2nd operation is a multiplication by F*(w) • The net multiplication is thus | F(w)|2 • These are also called two-pass filters Computational Geophysics and Data Analysis
The Butterworth Filter (Low-pass, 0-phase) Computational Geophysics and Data Analysis
… effect on a spike … Computational Geophysics and Data Analysis
… on a seismogram … … varying the order … Computational Geophysics and Data Analysis
… on a seismogram … … varying the cut-off frequency… Computational Geophysics and Data Analysis
The Butterworth Filter (High-Pass) Computational Geophysics and Data Analysis
… effect on a spike … Computational Geophysics and Data Analysis
… on a seismogram … … varying the order … Computational Geophysics and Data Analysis
… on a seismogram … … varying the cut-off frequency… Computational Geophysics and Data Analysis
The Butterworth Filter (Band-Pass) Computational Geophysics and Data Analysis
… effect on a spike … Computational Geophysics and Data Analysis
… on a seismogram … … varying the order … Computational Geophysics and Data Analysis
… on a seismogram … … varying the cut-off frequency… Computational Geophysics and Data Analysis
Zero phase and causal filters When the phase of a filter is set to zero (and simply the amplitude spectrum is inverted) we obtain a zero-phase filter. It means a peak will not be shifted. Such a filter is acausal. Why? Computational Geophysics and Data Analysis
Butterworth Low-pass (20 Hz) on spike Computational Geophysics and Data Analysis
(causal) Butterworth Low-pass (20 Hz) on spike Computational Geophysics and Data Analysis
Butterworth Low-pass (20 Hz) on data Computational Geophysics and Data Analysis
Other windowing functions • So far we only used the Butterworth filtering window • In general if we want to extract time windows from (permanent) recordings we have other options in the time domain. • The key issues are • Do you want to preserve the main maxima at the expense of side maxima? • Do you want to have as little side lobes as posible? Computational Geophysics and Data Analysis
Example Computational Geophysics and Data Analysis
Possible windows Plain box car (arrow stands for Fourier transform): Bartlett Computational Geophysics and Data Analysis
Possible windows Hanning The spectral representations of the boxcar, Bartlett (and Parzen) functions are: Computational Geophysics and Data Analysis
Examples Computational Geophysics and Data Analysis
Examples Computational Geophysics and Data Analysis
The Gabor transform: t-f misfits • phase information: • can be measured reliably • ± linearly related to Earth structure • physically interpretable • amplitude information: • hard to measure (earthquake • magnitude often unknown) • non-linearly related to structure [ t-w representation of synthetics, u(t) ] [ t-w representation of data, u0(t) ] Computational Geophysics and Data Analysis
The Gabor time window The Gaussian time windows is given by Computational Geophysics and Data Analysis
Example Computational Geophysics and Data Analysis
Multitaper Goal: „obtaining a spectrum with little or no bias and small uncertainties“. problem comes down to finding the right tapering to reduce the bias (i.e, spectral leakage). In principle we seek: This section follows Prieto eet al., GJI, 2007. Ideas go back to a paper by Thomson (1982). Computational Geophysics and Data Analysis
Multi-taper Principle • Data sequence x is multiplied by a set of orthgonal sequences (tapers) • We get several single periodograms (spectra) that are then averaged • The averaging is not even, various weights apply • Tapers are constructed to optimize resistance to spectral leakage • Weighting designed to generate smooth estimate with less variance than with single tapers Computational Geophysics and Data Analysis
Spectrum estimates We start with with To maintain total power. Computational Geophysics and Data Analysis
Condition for optimal tapers N is the number of points, W is the resolution bandwith (frequency increment) One seeks to maximize l the fraction of energy in the interval (–W,W). From this equation one finds a‘s by an eigenvalue problem -> Slepian function Computational Geophysics and Data Analysis
Slepian functions The tapers (Slepian functions) in time and frequency domains Computational Geophysics and Data Analysis
Final assembly Slepian sequences (tapers) Final averaging of spectra Computational Geophysics and Data Analysis
Example Computational Geophysics and Data Analysis
Classical Periodogram Computational Geophysics and Data Analysis
… and its power … Computational Geophysics and Data Analysis