Download
1 / 51
520 likes | 712 Views
Chapter3 Bacterial Growth. outline. 3.1 GROWTH IN PURE CULTURE IN A FLASK( Batch Culture) 3.2 CONTINUOUS CULTURE 3.3 GROWTH UNDERAEROBIC CONDITIONS. Chapter3 Bacterial Growth. Concepts.

E N D
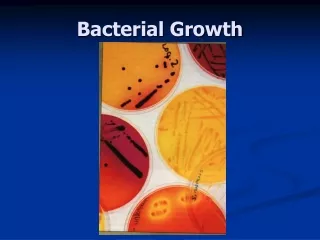
Chapter3 Bacterial Growth
outline 3.1 GROWTH IN PURE CULTURE IN A FLASK( Batch Culture) 3.2 CONTINUOUS CULTURE 3.3 GROWTH UNDERAEROBIC CONDITIONS
Chapter3 Bacterial Growth Concepts • Microbial growth is defined as an increase in cellular constituents and may result in an increase in a microorganism’s size, population number, or both.
人的生长 细菌的生长
Anabolism :synthesis of cell constituents and metabolites Catabolism: breakdown of cell constituents and metabolites Bacterial growth is a complex process involving numerous anabolicand catabolic reactions. Ultimately, these biosynthetic reactions result in cell division as shown in Fig. 3.1. FIGURE 3.1 Electron micrograph of Bacillus subtilis, a gram-positive bacterium, dividing.
Although our understanding of growth under controlled conditions is extensive, it is doubtful whether information obtained from laboratory culture studies can be easily extended to an understanding of growth in natural soil or water environments, where the level of complexity is increased tremendously (Fig. 3.2).
3.1 GROWTH IN PURE CULTURE IN A FLASK 摇瓶纯培养条件下的培养 Pure culture A culture containing only one strain of microorganism, which is usually derived from a single colony.
Typically, to understand and define the growth of an isolate of a particular microorganism, cells are placed in a flask in which the nutrient supply and environmental conditions are controlled. If the liquid medium supplies all nutrients required for growth and environmental parameters are optimal, the increase in numbers or bacterial mass can be measured as a function of time to obtain a growth curve. Several distinct growth phases can be observed within a growth curve (Fig. 3.3)
The usual practice, which is the most valid statistically, is to count colonies only on plates that have between 30 and 300 colonies. To make a 10-fold (10−1) dilution, one can mix 0.5 ml of sample with 4.5 ml of diluent, or 1.0 ml sample with 9.0 ml diluent. Viable Counting method
There are two approaches to the study of growth under such controlled conditions 1. batch culture
2. Continuous culture (Chemostat) Chemostat used for continuous cultures. Rate of growth can be controlled either by controlling the rate at which new medium enters the growth chamber or by limiting a required growth factor in the medium.
3.1.1 The Lag Phase(迟滞期) When an inoculum(接种物) is placed into fresh medium, growth begins after a period of time called the lag phase. The lag phase is thought to be due to the physiological adaptation of the cell to the culture conditions. The lag phase usually lasts from minutes to several hours. The length of the lag phase can be controlled to some extent because it is dependent on: 1. The type of medium; 2. The initial inoculum size; 3. physiological adaptation
Fig. 3.4 compares the degradation of phenanthrene(菲) in cultures inoculated(接种) with 107 and with 104 colony-forming units (CFU) /ml. Although the degradation rate achieved is similar in both cases (compare the slope of each curve), the lag phase was1.5days when a low inoculum size was used (104CFU/ml) in contrast to only 0.5 day when the higher inoculum was used (107 CFU/ml).
FIGURE 3.4 Effect of inoculum size on the lag phase during degradation of a polyaromatic hydrocarbon, phenanthrene. Because phenanthrene is only slightly soluble in water and is therefore not readily available for cell uptake and degradation, a solubilizing agent called cyclodextrin(环式糊精) was added to the system. The microbes in this study were not able to utilize cyclodextrin as a source of carbon or energy.
3.1.2 The Exponential Phase(指数生长期或对数生长期) The second phase of growth observed in a batch system is the exponential phase.The exponential phase is characterized by a period of cell division. The number of cells increases in the geometric progression 20, 21, 22, 24 until, after n divisions, the number of cells is 2n(Fig. 3.5).
X is the number or mass of cells (mass/volume),t is time, andμ is the specific growth rate constant(1/time).
3.1.3 The Stationary Phase The third phase of growth is the stationary phase.The stationary phase in a batch culture can be defined as a state of no net growth, which can be expressed by the following equation: Although there is no net growth in stationary phase,cells still grow and divide. Growth is simply balanced by an equal number of cells dying.
There are several reasons that a batch culture may reach stationary Phase: 1. Carbon and energy source or an essential nutrient becomes completely used up. 2.Waste products build up to a point where they begin to inhibit cell growth or are toxic to cells. When a carbon source is used up it does not necessarily mean that all growth stops. This is because dying cells can lyse and provide a source of nutrients. Growth on dead cells is called endogenous metabolism.
The stationary phase actually shows a small amount of growth(Fig. 3.6)
3.1.4 The Death Phase The final phase of the growth curve is the death phase, which is characterized by a net loss of culturable cells. Even in the death phase there may be individual cells that are metabolizing and dividing,but more viable cells are lost than are gained(产生) so there is a net loss of viable cells. The death phase is often exponential, The death phase can be described by the following equation:
3.1.5 Effect of Substrate Concentration on Growth Monod(莫诺,法国生物化学家) equation: μis the specific growth rate (1/time), μmax is the maximum specific growth rate (1/time) for the culture, S is the substrate concentration (mass/volume), Ksis the half-saturation constant (mass/volume).
Ksis defined as the substrate concentration at which growth occurs at one half the value of max(Ks是半饱和常数,其被定义为生长速率μ为μmax一半时的基质浓度). Both μmax and Ks reflect intrinsic physiological properties of a particular type of microorganism. They are also dependent on the substrate being utilized and on thetemperature of growth (see Information Box 1). The Monod equation can be expressed in terms of cell number or cell mass (X) 将公式 代入
The Monod equation has two limiting cases as shown in Fig. 3.7.
The first case is at high substrate concentration where S >>Ks. In this case, the specific growth rate μ is essentially equal to μmax. This simplifies the equation and the resulting relationship is zero orderor independent of substrate concentration: when the substrate concentration is low, growth (dX/dt) is dependent on the substrate concentration. Since the substrate concentration is in the numerator, as the substrate concentration decreases,the rate of growth will also decrease.
The second limiting case occurs at low substrate concentrations where S <<Ks as shown in Eq. 3.12. In this case there is a first order dependence on substrate concentration (Fig. 3.7):
The Monod equation has two limiting cases as shown in Fig. 3.7.
3.3 GROWTH UNDERAEROBIC CONDITIONS Under aerobic conditions, microorganisms utilize substrate by a process known as aerobic respiration. The complete oxidation of a substrate under aerobic conditions is represented by the mass balance equation:
Oxidation of glucose by microorganisms is more complex than shown in this equation because some of the substrate carbon is utilized to build new cell mass and is therefore not completely oxidized.Thus, aerobic microbial oxidation of glucose can be more completely described by the following, slightly more complex, mass balance equation:
It should be emphasized that the degradation process is the same whether the substrate is readily utilized (glucose) or only slowly utilized as in the case of a contaminant such as benzene. Equation 3.19 differs from Eq. 3.18 in two ways: it represents the production of new cell mass, estimated by the formula C5H7NO2, and in order to balance the equation, it has a nitrogen source on the reactant side, shown here as ammonia (NH3). Under either growth or nongrowth conditions, the amount of energy obtained by a microorganism through the oxidation of a substrate is reflected in the amount of cell mass produced, or the cell yield (Y).
FIGURE 3.11 Cell yield values for various substrates. Note that the cell yield depends on the structure of the substrate.
3.4 GROWTH UNDER ANAEROBIC CONDITIONS In anaerobic respiration,the terminal electron acceptor used depends on availability,and follows a sequence that corresponds to the electron affinity of the electron acceptors. Examples of alternative electron acceptors in order of decreasing electron affinity are nitrate (nitrate-reducing conditions), manganese (manganese-reducing conditions),iron (iron-reducing conditions), sulfate (sulfatereducing conditions), and carbonate (methanogenic conditions) (see Table 3.1).
The following equation can be used to describe the transformation of organic matter into methane (CH4) and CO2: where n, a, and b represent mole numbers.
3.5 GROWTH IN THE ENVIRONMENT 3.5.1 The Lag Phase The lag phase observed in a natural environment upon addition of a food source, particularly a contaminant,can be much longer than the lag phase normally observed in a batch culture. In some cases, this longerlag phase may be caused by very small initial populations that are capable of utilizing the added contaminant.In this case neither a significant disappearance of the contaminant nor a significant increase in cell numbers will be observed for several generations.
Summary • GROWTH IN PURE CULTURE IN A FLASK( Batch Culture) • CONTINUOUS CULTURE • GROWTH UNDERAEROBIC CONDITIONS