Download
1 / 17
170 likes | 282 Views
Organization of Course. Overall Project Issues & Examples Emissions Inventories Source-Receptor Post-Processing Source-Attribution for Deposition Model Evaluation Model Intercomparison Collaboration Possibilities. INTRODUCTION Course overview Air Toxics overview HYSPLIT overview

E N D
Organization of Course Overall Project Issues & Examples Emissions Inventories Source-Receptor Post-Processing Source-Attribution for Deposition Model Evaluation Model Intercomparison Collaboration Possibilities INTRODUCTION Course overview Air Toxics overview HYSPLIT overview HYSPLIT Theory and Practice Meteorology Back Trajectories Concentrations / Deposition HYSPLIT-SV for semivolatiles (e.g, PCDD/F) HYSPLIT-HG for mercury
Mercury Emissions Inventories For atmospheric modeling, MUST BE SPECIATED
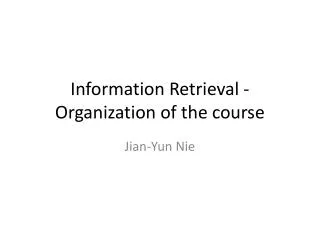
size/shape of symbol denotes amount of mercury emitted (kg/yr) 5 - 10 10 - 50 50 - 100 100 – 300 300 - 500 500 - 1000 1000 - 3500 color of symbol denotes type of mercury source coal-fired power plants other fuel combustion waste incineration metallurgical manufacturing & other Elemental Mercury -- Hg(0) -- Emissions to the Air 2002 U.S. data from USEPA National Emissions Inventory (NEI); 2002 Canadian data from Environment Canada; 1999 Mexican data from inventory prepared by Acosta y Asociados for the Commission for Environmental Cooperation
size/shape of symbol denotes amount of mercury emitted (kg/yr) 5 - 10 10 - 50 50 - 100 100 – 300 300 - 500 500 - 1000 1000 - 3500 color of symbol denotes type of mercury source coal-fired power plants other fuel combustion waste incineration metallurgical manufacturing & other Reactive Gaseous Mercury – RGM -- Emissions to the Air 2002 U.S. data from USEPA National Emissions Inventory (NEI); 2002 Canadian data from Environment Canada; 1999 Mexican data from inventory prepared by Acosta y Asociados for the Commission for Environmental Cooperation
size/shape of symbol denotes amount of mercury emitted (kg/yr) 5 - 10 10 - 50 50 - 100 100 – 300 300 - 500 500 - 1000 1000 - 3500 color of symbol denotes type of mercury source coal-fired power plants other fuel combustion waste incineration metallurgical manufacturing & other Particulate Mercury -- Hg(p) -- Emissions to the Air 2002 U.S. data from USEPA National Emissions Inventory (NEI); 2002 Canadian data from Environment Canada; 1999 Mexican data from inventory prepared by Acosta y Asociados for the Commission for Environmental Cooperation
size/shape of symbol denotes amount of mercury emitted (kg/yr) 5 - 10 10 - 50 50 - 100 100 – 300 300 - 500 500 - 1000 1000 - 3500 color of symbol denotes type of mercury source coal-fired power plants other fuel combustion waste incineration metallurgical manufacturing & other Total Mercury Emissions to the Air [ Hg(0) + RGM + Hg(p) ] 2002 U.S. data from USEPA National Emissions Inventory (NEI); 2002 Canadian data from Environment Canada; 1999 Mexican data from inventory prepared by Acosta y Asociados for the Commission for Environmental Cooperation
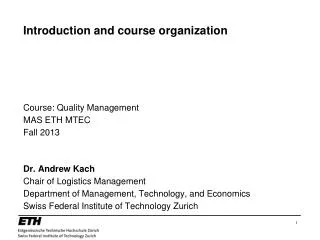
Some events in the U.S. regulation and prevention of mercury emissions 1965 1970 1975 1970’s - 1990’s: many mercury-cell chlor-alkali plants converted to alternate processes or closed due to regulatory and other pressures 1980 1985 Clean Air Act Amendments of 1990 – calls for Maximum Achievable Control Technology (MACT) to regulate hazardous air pollutants; intent is to prohibit emissions trading for these air toxics 1990 • 1990’s – Hg emissions from municipal and medical waste incinerators fall dramatically due to: • closure of some municipal waste incinerators and many medical waste incinerators • MACT-related pollution control requirements • reduction in mercury content of waste (e.g., battery legislation) 1995 2002 – Clear Skies Initiative for power plants introduced (ultimately withdrawn) 2000 2005 – CAIR (Clean Air Interstate Rule) for power plants (Hg reduced as co-benefit of SO2 & NOx controls) 2005 – EPA meets court-ordered deadline and promulgates CAMR (Clean Air Mercury Rule) for power plants – based on Hg emissions trading 2005 “Hot Spot” Controversy -- Many States sue EPA & propose / promulgate more strict regulations 2010 2008 – CAMR and CAIR overturned... What is next?
Direct, Anthropogenic Mercury Emissions in the United States (data from USEPA)
Source of global data: Global Anthropogenic Mercury Emission Inventories for 2000 and 1995: Pacyna, J. and E. Pacyna. Journal of Air and Waste Management Association (in prep. 2005); http://www.amap.no/Resources/HgEmissions/HgInventoryDocs.html 10
Different patterns of anthropogenic mercury emissions Source: U.S. EPA Source: Streets et al., 2005, “Anthropogenic mercury emissions in China”, Atmospheric Environment 39, 7789-7806 Source: Environment Canada 11
Some Current Emissions Inventory Challenges • Re-emissions of previously deposited anthropogenic Hg • Emissions speciation [at least among Hg(0), Hg(II), Hg(p); more specific species if possible] • Reporting and harmonization of source categories • Mobile source emissions? • Enough temporal resolution to know when emissions for individual point sources change significantly Note: Hg continuous emissions monitors now commercially available 12
Variations on time scales of minutes to hours • CEM’s needed – and not just on coal-fired power plants • CEM’s must be speciated or of little use in developing critical source-receptor information • Clean Air Mercury Rule only requires ~weekly total-Hg measurements, for purposes of trading We don’t have information about major events • e.g., maintenance or permanent closures, installation of new pollution control devices, process changes • Therefore, difficult to interpret trends in ambient data Long delay before inventories released • 2002 inventory is being released this year in U.S.; till now, the latest available inventory was for 1999 • How can we use new measurement data? Temporal Problems with Emissions Inventories
Hg from other sources: local, regional & more distant atmospheric deposition to the water surface atmospheric deposition to the watershed Measurement of ambient air concentrations Measurement of wet deposition 14
Thanks to Marty Keller, Senior Applications Engineer, Tekran Instruments Corporation, for providing this graph!
Overall Budget of Power Plant 1000 MW x $0.10/kw-hr = $1,000,000,000 per year Speciation Continuous Emissions Monitor (CEM): ~$200,000 to purchase/install Cost of Electricity 0.10/kw-hr 0.10001/kw-hr $1000/yr $1000.10/yr Total: ~$100,000/yr Amortize over 4 yrs: ~$50,000/yr ~$50,000/yr to operate
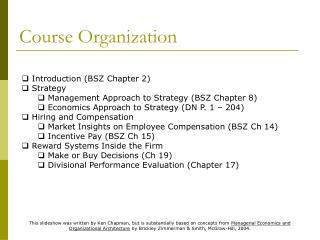
2000 Global Inventory New York inventory 1995 Canada Inventory 2000 Canada Inventory Ontario inventory ? 1999 US Inventory 2002 US Inventory ? speciated atmospheric Hg measurements at site x Hypothetical – just for illustration purposes speciated atmospheric Hg measurements at site y speciated atmospheric Hg measurements at site z For model evaluation, inventory must be accurate and for same period as measurements (a big challenge!) 95 96 97 98 99 00 01 02 03 04 05 06 07 08 09 10 11 12 13 14 15 17