Download

1 / 40
420 likes | 645 Views
Environment – Economic Accounts in Mauritius. Prepared by: Mr . Anand Sookun ( asookun@gmail.com), Mrs Nalini Meenowa, (cso_energy@mail.gov.mu) Statistics Mauritius Mr. Jean Louis Weber, Independent Consultant ( jlweber45@gmail.com)

E N D
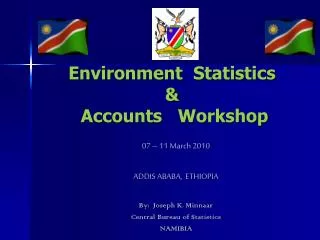
Environment – Economic Accounts in Mauritius Prepared by: Mr. Anand Sookun (asookun@gmail.com), Mrs Nalini Meenowa, (cso_energy@mail.gov.mu) Statistics Mauritius Mr. Jean Louis Weber, Independent Consultant (jlweber45@gmail.com) Presented by: Mrs Nalini Meenowa Expert Meeting……..
Contents • Introduction • Types of Environmental – Economic Accounts (EEA) developed • Energy use and Atmospheric Emissions Accounts • Water Accounts • Material Flows Accounts • Ecosystem/Natural Capital Accounts • Way forward • Conclusion
Background • Location • Population : 1.27 Million • Area of Republic of Mauritius : 2,040 km2 • Is. of Mauritius1865 km2 and • Islands of Rodrigues, Agalega and Chagos Archipelago – approx 108 km2 • Major Climatic Conditions: Sub Tropical Summer & Winter • Average annual rainfall : approx. 2000 mm • Population Density:600 inhabitants/km2
The need for environmental accounting under the policy contexts In Mauritius, the environmental issues are a matter of concern with population rise, economic developments in tourism and manufacturing, among others. The need for and use of proper statistics and accounts have been clearly felt in studies carried out such as:The National Self Capacity Assessment for Environment (2005),The National Assessment Report on the Mauritius Strategy for Implementation of Sustainable Development in SIDS (2010), and The Mauritius Environment Outlook Report (2011). Maurice Ile Durable
Environmental Accounts and the policy context Sustainable Consumption and Production Energy Policy Sustainable Tourism Data Evidence Statistics Indicators Analysis Modelling Scenarios Surveys National Accounts Environmental Accounts Maurice iledurable Science
The set up • For the EEA, UNDP Consultant’s (Mr Rocky Harris) first mission (circa 2008) established priorities and sources for the Environmental-Economic Accounts • Energy use and atmospheric emissions • Water use • Material flows • Second mission (circa 2009), supported by AFD • Compilation and estimation for 2002 • Illustrative applications, glossy brochure • Third mission (circa 2010) • Update for 2007 • Interpolation and extrapolation • Analysis and dissemination
The set up updated • For the EEA Water UNSD supported capacity building (2011 and 2012) with some technical assistance from the Inter-Regional Advisor on SEEA (Mr Ricardo Martinez-Lagunes) • Regional Workshop was held in Mauritius • Preliminary Water Statistics and Accounts report was drafted • In 2012, the Indian Ocean Commission (IOC) supported the development of Ecosystem/Natural Capital Accounts with a Consultant’s (Mr Jean Louis Weber) first mission in April 2013: • Data stocktaking was carried out • Second mission (Sept 2013): • Creation of GIS database • Production of preliminary accounts
Reference manuals adopted • FDES 2013, • SEEA CF 2012 • The SEEA-Water • IRWS, • ISIC • and CPC
Index (2000=100) Selected Results for Energy Use and Atmospheric Emissions Accounts No decoupling for key SCP sectors1 in Mauritius yet Gross Value Added Carbon dioxide * Primary energy use* 1. SCP key sectors are all industrial sectors except agriculture, electricity and water supply, and public transport. * Including energy and emissions relating to electricity production, based on constant factors per unit of electricity.
Selected Results for Energy Use and Atmospheric Emissions Accounts CO2 emissions from Mauritius key SCP sectors (ktCO2) Freight transport and business travel Electricity use * Manufacturing use of carbon fuels * Based on constant (average) emission factor per unit of electricity consumed
Selected Results for Water use accounts • Share of market activity
Selected Water use AccountsIndicators of Water Accounts by selected industrial groups, 2002 and 2007
Selected Results for Water use accounts Index (2000=100) Gross Value Added No decoupling for hotels in Mauritius yet Water use 1. SCP key sectors are all industrial sectors except agriculture, electricity and water supply, and public transport.
Selected Results for ExperimentalWater use and Energy use accounts linkages Linking greenhouse gas emissions and water use Water supply treatment 24 ktCO2 Lakes and reservoirs Direct abstractions Water company admin 5ktCO2 465mcm 216mcm Water distribution14ktCO2 Leakage 10ktCO2 Agriculture 65mcm 45mcm 105mcm Non-domestic use Domestic use Waste water treatment 50ktCO2 Waste water collection 5ktCO2
Material Flow Accounts ... ... produce flawed and potentially misleading aggregate indicators Possible applications: • Material intensity of construction – is construction output decoupling from resource use? • Physical Balance of Trade – are we consuming a greater share of the world’s resources
Example from UK construction output and use of construction materials
Status of Latest Water Accounts This report is the first comprehensive one to show the relationship between the environment and the economy Water accounts presented in physical terms while monetary values are presented in summarised forms.
Water Accounts • Data Sources: • Census of Economic Activities, CSO • Water Resources Unit • Central Water Authority – Water Supplier • Wastewater Management Authority • Irrigation Authority?? • IPP?? • Central electricity Board??
Water use accounts based mainly on Census of Economic Activities • Water Use :An analysis of water useby sector reveals that, as might be expected, agriculture is a relatively intensive user (50%), hydropower-29%, households-9%, Manufacturing-2% and remaining UFW-10% • Water use intensity indicates the amount of water in million cubic metres used by a particular sector of the economy per million rupees of Gross Value Added (GVA) generated in that sector. Hydro power and Agriculture main. Though both have dropped 14 % and 25% respectively from 2002 to 2007 • Water productivity measures the GVA generated in a particular sector per unit volume of water used. In 2007, this indicator was highest in ‘Construction’ and ‘Wholesale and Retail’ sectors with over Rs 20,000 million of GVA generated per million m3 of water used. ‘Agriculture’ and ‘Production of electricity’ sectors had the lowest rate with 17 million and 9 million rupees per million m3 of water used respectively
Physical water stocks and flows within the environment Water Resources in Mauritius • Surface water resources • 6 impounding reservoirs total capacity = 77.4 Mm3 annual yield = 135 Mm3 • 6 Potable Water Treatment Plants • 3 major river abstractions (for Potable Water Supply) • 25 major river basins • 350 river run off takes • Groundwater resources • 5 main aquifers • 406 wells • 300 Observation Wells • 107 Flow measuring station • 114 Potable (90% of total Groundwater production) • 156 Private Agricultural (6%) • 136 Industrial (4%)
RAINFALL PATTERN Normal Monthly Precipitation (1971-2000) in Mauritius Average Annual Rainfall = 2011 mm Summer = 1340 mm Winter = 660 mm Precipitation mm 3600 mm 3000 mm 2000 mm 1000 mm 6
Average annual rainfall as compared to normal (long term average 1971-2000), 1996 - 2011
The renewable water resources is slightly above 2000 cubic metres. • If Renewable water supply less than 1700 m3/person/yr, it is an indicator of water stress condition • Mauritius is among African countries vulnerable to water stress. (actual supply isaround 2000m3/person/yr )
Water flows in the environment and the economy –Island of Mauritius 2011
Precipitation and Evapotranspiration A large portion of the precipitation is almost immediately returned to the atmosphere as evaporation and transpiration, typically known as evapotranspiration. The rest of the precipitation, often called effective precipitation, flows through the territory as surface runoff or as infiltration in the soil due to the force of gravity. Water eventually reaches the sea or other accumulation areas within the territory, such as lakes, artificial reservoirs or aquifers. In both cases it is eventually evaporated to contribute to generate more precipitation completing the water cycle
Water resources in Mauritius • Water Resources in Mauritius • Surface water resources • 6 impounding reservoirs • total capacity = 77.4 Mm3 • annual yield = 135 Mm3 • 6 Potable Water Treatment Plants • 3 major river abstractions (for Potable Water Supply) • 25 major river basins • 350 river run off takes • Groundwater resources • 5 main aquifers • 406 wells • 300 Observation Wells • 107 Flow measuring station • 114 Potable (90% of total Groundwater production) • 156 Private Agricultural (6%) • 136 Industrial (4%)
Water and Climate ChangeThe impact of climate change will most certainly be felt on the water security in Mauritius. Water availability is becoming a major concern with unpredictable precipitation patterns. Climate change will certainly affect the amount of renewable water resources available for use in the future, and causing droughts.
The Natural Capital/Ecosystem Capital Accounting (ENCA) project for Mauritius Because ecosystem resilience is a central component of sustainable development and adaptability to climate change, the Government of Mauritius and the Indian Ocean Commission have decided to launch an experiment of ecosystems/natural capital accounts in the context of Implementation of the Small Island Developing States 'Mauritius Strategy' in the Eastern and Southern Africa and Indian Ocean (ESA-IO) region.
SEEA-ECA Ecosystem Capital Accounts National Accounts: SNA and SEEA The System of Environmental-Economic Accounts adopted by the UN Statistical Commission in 2012 (SEEA 2012) has been supplemented in 2013 by a volume on “Experimental Ecosystem Accounting”. The “Ecosystem Capital Accounts” (SEEA-ECA) under implementation in Europe are one of these experimentations. SEEA-EEA XXX SEEA Part 1 “Central Framework” SNA SEEA-EEA YYY SEEA Part 2 “Experimental Ecosystem Accounting” Jean-Louis Weber, 19 July 2013
SEEA-ECA-EU Ecosystem Capital Accounts National Accounts: SNA and SEEA The System of Environmental-Economic Accounts adopted by the UN Statistical Commission in 2012 (SEEA 2012) has been supplemented in 2013 by a volume on “Experimental Ecosystem Accounting”. The “Ecosystem Capital Accounts” (SEEA-ECA) under implementation in Europe are one of these experimentations. SEEA-EEA XXX SEEA Part 1 “Central Framework” SNA SEEA Part 2 “Experimental Ecosystem Accounting” SEEA-ENCA-MU Ecosystems/ Natural Capital Accounts Jean-Louis Weber, 19 July 2013
Region Calculation of Ecological Values in ECU & Total Ecosystem Capability (TEC) Ecosystem Indexes of Accessible Carbon/ Biomass SUM Indexes of Accessible Water Indexes of Accessible Landscape/ Biodiversity Services SUM / 3 = X ECU-Prices ECU values per 1 km2 grid-cells Basic resource (e.g. tons of Carbon/ Biomass) TEC: Total Ecosystem Capability (ECU) Jean-Louis Weber, 20July 2013
Results for ENCA : • Land cover and changes • from 2000 to 2010 Urban land cover
Woody biomass/ tons of C • Results for ENCA : • The biomass-carbon account Change in NPP/ tons of C Sugar cane harvest/ tons of C
Results for ECA: the ecosystem water account Accessible water by catchment, 2010, Mm3 Water use intensity stress index (stress when <100)
Results for ECA: The systems and species biodiversity account Net Landscape Ecosystem Potential 2010 by River basins [a], Districts [b] and Municipalities [c] [a] [b] [c]
Results for ECA: the Sea Coastal Ecosystems test account Coralreefsvulnarability index (ESA project) SeaCoastalUnits state account 2010
Database on water • Time series • Satellite data for ECA (land cover change) and water accounts • Extention to others accounts – e.g wastes, fisheries, etc Way forward
Thank You…