Download
1 / 27
270 likes | 410 Views
Final Project for DESE-6070HV7 Statistical Methods for Reliability Engineering Dr. Ernesto Gutierrez-Miravete Rensselaer at Hartford 05Dec08. Reliability Evaluation of Trailer Axles -Larry McLean. Reliability Evaluation of Trailer Axles. TABLE of CONTENTS

E N D
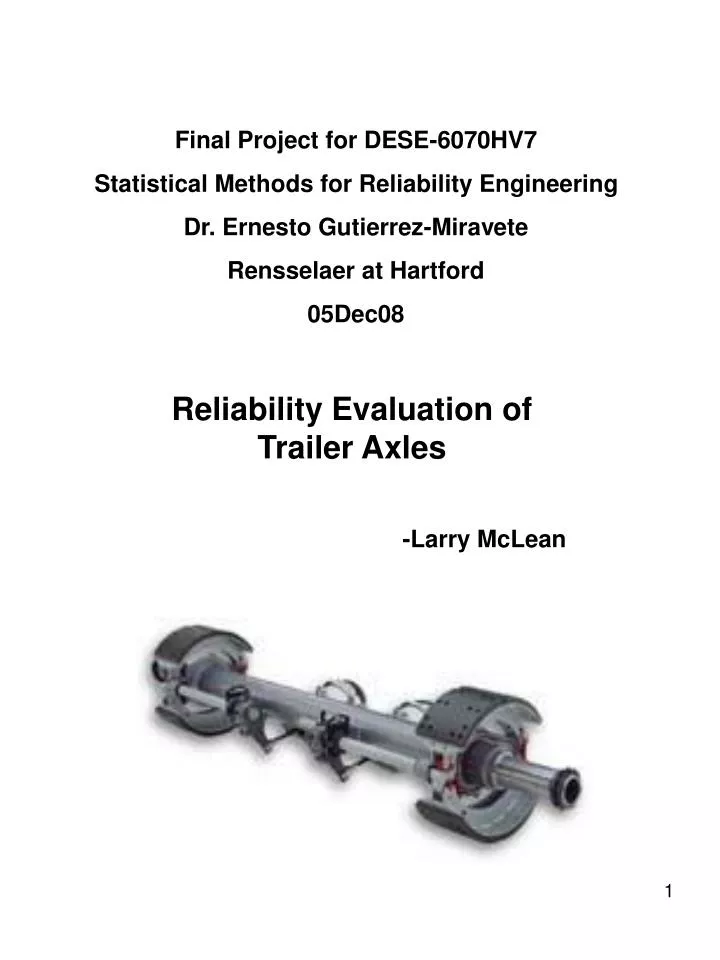
Final Project for DESE-6070HV7 Statistical Methods for Reliability Engineering Dr. Ernesto Gutierrez-Miravete Rensselaer at Hartford 05Dec08 Reliability Evaluation of Trailer Axles -Larry McLean
Reliability Evaluation of Trailer Axles TABLE of CONTENTS TITLE: PG Executive Summary…………………………...………………..3 Recommendations……………...…....…………………………3 Conclusions………………………………………………………3 Introduction………………………………………………………4 Component Description………………………………………..5 Component Reliability Structure……………………………..5 Component Test Description………………………………….7 Component Test Results………………………………………9 Component Test Data Reduction……...……………………10 Component Context (System Description)………………..17 System Reliability Analysis…………………...……………..18 Appendix 1: Component FMEA……………..………………26
Executive Summary • A process for evaluating the in-service reliability of a trailer axle is described here. • Since the trailer axle has undergone some testing, it has been used to characterize the reliability behavior of the axle, based on some simplifying assumptions. A more complete analysis is recommended involving stress analysis of the component. • Using simplifying assumptions, a sample calculation is done to calculate the in-service reliability of the axle. Due to lack of data, the calculation, has no basis in reality, but would be useful as a model for performing a real analysis. • Maple, Minitab and ‘R’ were indispensable in manipulating and curve-fitting data and creating equations that made fundamental analysis possible. • Recommendations • On the occasion of further testing, place strain gauges at key locations on the axle. • Finite Element stress analysis of the axle. • Detailed information about the material properties of the axle would allow comparison between analysis and testing to be meaningful. • With this information and the rig test, it could be determined if the component was attaining its expected life. • It also would provide a vehicle for studying the design features with the twin aims of increasing reliability and reducing cost. • Field testing to determine the environment that the axle is subjected to in-service. • The objective of this testing would be to derive equations that could describe the service mission of the axle and allow a complete analysis of the reliability. • Strain gauges coupled with trailer load information, road conditions and trailer speed are all important. • A model of the trailer and associated suspension hardware. • This would allow a prediction of the impact of varying environmental factors on the forces the axle sees. • This would extend the usefulness of field testing and minimize the testing required. • Conclusions • The axle system reliability functions can be represented by using a single Weibull equation. • The failure mode of the axle was consistent and demonstrated two symmetrical weak points on the axle. • By generalizing Miner’s Rule, it is possible to create ‘mission’ formulas that can be used to estimate axle reliability. • Monte Carlo methods are useful in taking these general equations and predicting in-service axle reliability. • Using fitting techniques, the reliability curve can become the basis for calculating all the traditional reliability functions.
Other Failures LHS Load Point Failure RHS Load Point Failure 77.5” Bearing Span 44” Springs Axle Brakes Wheels Figure #2: The Axle Component Figure #3: Axle Failure Event Tree
Separate(R1=R2): Shape: 6.89321 Scale: 233,763 Rss=R1*R2 MTTFss=197,593 cycles Merged: Shape: 6.83966 Scale: 212,004 MTTFsm=198,076 cycles Figure #7: Comparison of “Merged” vs “Separate” Probability Density Distributions
Figure 8: Probability Plots of Failure Data (Separate Modes) Figure 9: Weibull Plots of Failure Data (Separate Modes)
Figure 10: Probability Plots of Failure Data (Merged Modes) Figure 11: Weibull Plots of Failure Data (Separate Modes)
Probability Density Distribution around S-N curve (derived from test data) Log (S;F) 3sigma lines Su; Fu S-N Mean Curve: N=(F/bN)^1/mN bN=153008 mN=-0.10034 St; Ft Se; Fe Log N Nu=10^3 N t = MTTFsm =198,076 cycles Ne=10^6 Se = Endurance Limit of Material Su = Ultimate Tensile Strength of the Material St = Peak tensile stress (somewhere on the axle) during testing Fe = Load applied to the axle when the peak stress is Se (somewhere on the axle) Fu = Load applied to the axle when the peak stress is Su (somewhere on the axle) Ft = Load applied to the axle when the peak stress is St (somewhere on the axle) Calculation of MTTF of Log-Log Line for S-N Diagram Figure 13: Calculation of axle S-N Characteristic
Figure #14: Weibull Probability Plots of Monte Carlo Analysis to determine bN distribution to match Test Data
Truck/TrailerSystem Truck Trailer Frame Running Gear Storage Container Bearings Brakes Wheels Support Structure axles Turning System Structure Function Figure #15: System Diagram
axle Structural Evaluation Mission Specification Static Loading Material Selection and Fabrication Process Dynamic Loading and Structural Analysis of attachments (Brakes, bearings, cams…etc) Figure #16: Structural Requirements of axle
Field Data Nominal Mission Definition • Variation in Cargo Load • Variation in Road Surface • Variation in vehicle speed • Driving habits Data Reduction and Analysis Road Test Results Mission Inputs: Axle Load (or stress) frequency distribution Rig Data Axle Strength Characteristics: Axle F/N Diagrams Monte Carlo Axle Reliability Calculation Axle Fatigue Performance Characteristics Output: Axle Reliability Figure #17: Reliability Analysis
Mission Definition: Test Results Frequency Speed 2 Dynamic Load (Variable Stress) Speed 1 Cargo Load (Mean Stress) Figure #18: Mission Data Other Variables: • Road: 1) Rural Road; 2) Secondary; Road 3) Highway
Log F Se = endurance limit; Su=ultimate tensile strength Fu, Su Failure Limit (N) “n” Mission Inputs (n) Fe, Se nR=n/N=damage done per hour of use Log N Miner’s Rule: If n1/N1+n2/N2+…+nr/Nr<1 then a failure will not occur. “n” and “N” are each stochastic in nature. Representing n/N approximately as a continuous function, the above formula can be generalized to: • The integral of “n/N” over time gives an accumulated axle damage (D). Figure #19: Linking Mission data to Axle Characteristics
Sample Solution: By assuming that n can be represented by a formula of the form: And: The ratio “n/N” can be written: A plot of the “N” and the “n” curve according with the above assumptions is plot on a Log-Log chart in Figure #19: Figure #20: Reliability Plot for Axle
Results of MC Analysis Figure #21: Fitted Plot of Reliability Results
MTTF=99064 Figure 22: Plots of Axle Reliability Functions Generated by Maple Probability Density Function Hazard Function
List of References-Textbooks: Faires, V.M., Design of Machine Elements (4th Ed), the MacMillan Company, 1965. Shigley, J.E., Mechanical Engineering Design, McGraw-Hill, 1977. Rausand, M and Hoyland, A., System Reliability Theory (2nd Ed), John Wiley and Sons, 2004. Verzani, John, Using R for Introductory Statistics, Chapman and Hall/CRC, 2005 Abernathy, R.E.; Breneman, J.E.; Medlin, CH; Reinman, GL; Weibull Analysis Handbook; November 1983.