Download
1 / 1
10 likes | 175 Views
LABORATORY COMPETENCE FOR BIOAEROSOL MEASUREMENT: DEVELOPMENT OF A PROTOCOL FOR DATA QUALITY CONTROL. R. Giovinazzo 1 , P. Calabrese 2 , E. Guerrera 1 , M. Mameli 1 , G. Marena 1 , T. Mastromartino 1 , D. Sarto 1 , M . Veltroni 2. ITALIAN WORKERS' COMPENSATION AUTHORITY ( INAIL )

E N D
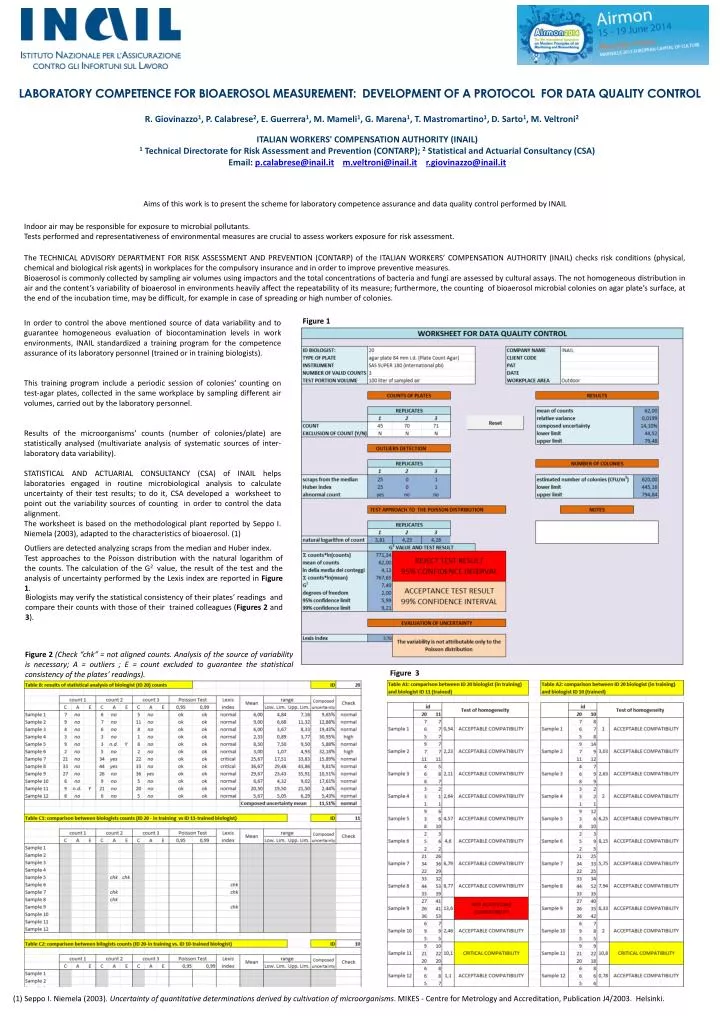
LABORATORY COMPETENCE FOR BIOAEROSOL MEASUREMENT: DEVELOPMENT OF A PROTOCOL FOR DATA QUALITY CONTROL R. Giovinazzo1, P. Calabrese2, E. Guerrera1, M. Mameli1, G. Marena1, T. Mastromartino1, D. Sarto1, M. Veltroni2 ITALIAN WORKERS' COMPENSATION AUTHORITY (INAIL) 1 Technical Directorate for Risk Assessment and Prevention (CONTARP); 2Statistical and Actuarial Consultancy (CSA) Email:p.calabrese@inail.itm.veltroni@inail.itr.giovinazzo@inail.it Aims of this work is to present the scheme for laboratory competence assurance and data quality control performed by INAIL Indoor air may be responsible for exposure to microbial pollutants. Tests performed and representativeness of environmental measures are crucial to assess workers exposure for risk assessment. The TECHNICAL ADVISORY DEPARTMENT FOR RISK ASSESSMENT AND PREVENTION (CONTARP) of the ITALIAN WORKERS’ COMPENSATION AUTHORITY (INAIL) checks risk conditions (physical, chemical and biological risk agents) in workplaces for the compulsory insurance and in order to improve preventive measures. Bioaerosol is commonly collected by sampling air volumes using impactors and the total concentrations of bacteria and fungi are assessed by cultural assays. The not homogeneous distribution in air and the content’s variability of bioaerosol in environments heavily affect the repeatability of its measure; furthermore, the counting of bioaerosol microbial colonies on agar plate’s surface, at the end of the incubation time, may be difficult, for example in case of spreading or high number of colonies. Figure 1 In order to control the above mentioned source of data variability and to guarantee homogeneous evaluation of biocontamination levels in work environments, INAIL standardized a training program for the competence assurance of its laboratory personnel (trained or in training biologists). This training program include a periodic session of colonies‘ counting on test-agar plates, collected in the same workplace by sampling different air volumes, carried out by the laboratory personnel. Results of the microorganisms’ counts (number of colonies/plate) are statistically analysed (multivariate analysis of systematic sources of inter-laboratory data variability). STATISTICAL AND ACTUARIAL CONSULTANCY (CSA) of INAIL helps laboratories engaged in routine microbiological analysis to calculate uncertainty of their test results; to do it, CSA developed a worksheet to point out the variability sources of counting in order to control the data alignment. The worksheet is based on the methodological plant reported by Seppo I. Niemela (2003), adapted to the characteristics of bioaerosol. (1) Outliers are detected analyzing scraps from the median and Huber index. Test approaches to the Poisson distribution with the natural logarithm of the counts. The calculation of the G2 value, the result of the test and the analysis of uncertainty performed by the Lexis index are reported in Figure 1. Biologists may verify the statistical consistency of their plates’ readings and compare their counts with those of their trained colleagues (Figures 2 and 3). Figure 2 (Check “chk” = not aligned counts. Analysis of the source of variability is necessary; A = outliers ; E = count excluded to guarantee the statistical consistency of the plates’ readings). Figure 3 (1) Seppo I. Niemela (2003). Uncertainty of quantitative determinations derived by cultivation of microorganisms. MIKES - Centre for Metrology and Accreditation, Publication J4/2003. Helsinki.