Download

1 / 100
1.01k likes | 1.37k Views
Calculating and Interpreting Slope: Implications for School Psychologists. Caitlin S. Flinn, Ed.S. & Andrew E. McCrea, M.S., NCSP ASPP/PSU Conference October 8, 2009. Translations…. ROI = Rate of Improvement, Slope RTI = Response to Intervention SLD = Specific Learning Disability

E N D
Calculating and Interpreting Slope: Implications for School Psychologists Caitlin S. Flinn, Ed.S. & Andrew E. McCrea, M.S., NCSP ASPP/PSU Conference October 8, 2009
Translations… • ROI = Rate of Improvement, Slope • RTI = Response to Intervention • SLD = Specific Learning Disability • DD = Dually Discrepant
Conceptualization Importance Definitions Functions Graphing in Excel Individual Graphs Calculating ROI Decision Making Grounding the Data Interpreting Growth Individual Student Student Groups Considerations Overview
Graphs in Education • Core instruction efficacy • Batsche, et al., 2005 • Data-driven instruction • NCLB, 2001; IDEA, 2004 • Incremental skill growth • Colvin, Sugai, Good, & Young-Yon, 1997 • Intervention effectiveness • Batsche, Castillo, Dixon, & Forde, 2008 • Setting goals • Shapiro, 2008 • Progress monitoring • Wright, 2008; Fuchs & Fuchs, 1997
Graphs in Education • Assessing level and rate • Batsche, Castillo, Dixon, & Forde, 2008 • Self monitoring • Fuchs et al., 2006 • IEP goals • Shinn, 2008 • Professional accountability • Sulzer-Asaroff & Mayer, 1991 • Treatment integrity • Mortenson & Witt, 1998 • Teacher performance feedback • Noell et al., 2005
Why do we like graphs so much? • Seeing is believing! • A picture is worth a thousand words! • People remember • Speeches that included visuals, especially in color, improved immediate recall by 8.5% and delayed recall (3 days) by 10.1% (Vogel, Dickson, & Lehman, 1990) • Visual aids are more effective for communicating large amounts of information quickly • Transcend language barriers (Karwowski, 2006)
Is seeing enough? • If there are only two data points, basic slope calculation is accurate.
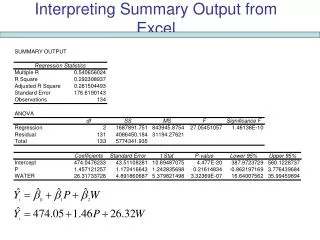
Why do I need to know ROI? • This is also how to calculate an aimline.
If there are multiple data points, should you calculate the slope between the first and last data points only? Why Bother with all the Data?
ROI in Educational Decisions Data (slope) Interpretation (progress?) Decision Instructional Need
Quick Stretch of the Mind • Data • Benchmark: 77 • Diego: 41 • Interpretation • NOT GOOD! • Decision • ??? • Will Diego catch up? • Do you have enough info?
Data Benchmark: 77, 92 Diego: 41, 62, 63 Interpretation Slightly better Decision ??? Will Diego catch up? Do you have enough info? Quick Stretch of the Mind
Data Benchmark: 77, 92 Diego: 41 … 104 Interpretation Good work Decision Cured!!! Will Diego maintain that progress? Quick Stretch of the Mind
Data Benchmark: 77, 92 Diego: 41 … 74 Interpretation Ummm Decision Uh oh… What EXACTLY IS Diego’s Progress?? Quick Stretch of the Mind
Quick Stretch of the Mind • Now can you make a decision?
Rationale for Importance of ROI • Shift from discrepancy to RtI for SLD eligibility determination • Use of ROI to determine lack of RtI • Questions to be Empirically Answered • What parameters of ROI indicate lack of RtI? • How does ROI present between SLD and non-SLD? • What are reasonable goals using ROI?
School psychological practices including more CBM as a result of IDEA 2004 and NCLB 2001 CBM is great because: Comparisons Dual discrepancy Efficient Federal regulations Graph GOM Goal setting Instructional planning Multi-tiered assessment Match instructional level Norms available Parents Progress monitoring Survey level assessments Sensitive to change Screening Systems-level Technically adequate Rationale for Importance of ROI
Rate of Improvement • Algebraic terms: • slope is the change in the output because of the input, over time • a way of looking at growth • Aimline: expected performance • Trendline: actual performance • Definitions: • Fuchs and Fuchs (1998) • Batsche, Castillo, Dixon, and Forde (2008)
Rate of Improvement • Shapiro (2008) • Criteria for setting reasonable, achievable, and ambitious goals • Fuchs, Fuchs, Hamlett, Walz, and Germann (1993) • weekly rates of growth in curriculum-based measurements • slopes between 1.5 and 2.0 times that of their peers were most likely to remediate skill deficits with current instruction
Functions of ROI • Comparisons • peers/class • local norms/district • national norms
Functions of ROI • A decision tool • Shinn’s estimate for decision-making in RTI trainings in Pennsylvania (Kovaleski, 2008) • Slope of 2.0x or greater (than expected slope, to close the gap)
Rate of Improvement and RTI • Fuchs and Fuchs (1998) • hallmark components of RTI • ongoing formative assessment • identifying non-responsive students • treatment fidelity of core / supplemental instruction • “dual discrepancy” • a student performing at or greater than one standard deviation from typically performing peers in • (a) level (i.e., grade) and • (b) rate (slope)
Eligibility and ROI • School psychologists • Adopt use of additional information (CBM!) • “Snapshot” data • Good day, bad day data Versus • Data continuously collected over time • Data that accounts for good days and bad days! • Eyeball the graph vs. decision guidelines
Determining SLD in an RTI Model • Gresham, 2001 • RTI is viable alternative for identifying learning disabilities • Stuebing, Fletcher, LeDoux, Lyon, Shaywitz, & Shaywitz, 2002 • Poor reliability and validity of discrepancy model
Determining SLD in an RTI Model • Gresham, 2001 • 3 models of RTI • predictor-criterion • dual discrepancy • applied behavior analytic
Determining SLD in an RTI Model • Gresham, 2001 • All three models involved: • multiple tiers of intervention • progress monitoring • effective instructional strategies • support for applying the RTI model to identifying students for learning disabilities
Eligibility and ROI • Deno, Fuchs, Marston, and Shin, 2001 • slopes of children identified as frequently non-responsive to robust interventions approximated the slopes of children already identified as having a specific learning disability • supportive evidence for dual-discrepancy model
Summary of ROI Research Through an RTI model, students receive instruction based on data. Rate of improvement, or slope, has surfaced in the literature as an indicator for making instructional decisions. Although research is expanding in terms of reliability and validity for both RTI and ROI, extant studies allude to strong utility for educational planning.
Reading Oral Reading Fluency (ORF) Word Use Fluency (WUF) Reading Comprehension MAZE Retell Fluency Early Literacy Skills Initial Sound Fluency (ISF) Letter Naming Fluency (LNF) Letter Sound Fluency (LSF) Phoneme Segmentation Fluency (PSF) Nonsense Word Fluency (NWF) Spelling Written Expression Behavior Math Math Computation Math Facts Early Numeracy Oral Counting Missing Number Number Identification Quantity Discrimination Skills Typically Graphed
Get out your laptops! Open Microsoft Excel I love ROI
Open Microsoft Excel In cell B2, type School Week to represent the weeks of school In cell C2, type Benchmark to represent the benchmarks or goals of the skill you are graphing In cell D2, type WPM to represent Words Per Minute (or an abbreviation the basic skill you are graphing) Setting Up Your Spreadsheet
In cell B3, type 1 to represent the first week of school Continue numbering to 36 in column 2 Why 36? There’s typically 36 school weeks per school year. Finish at cell B38 Labeling School Weeks
In cell C3, type the number that represents the fall benchmark (months 1-3) of the skill you are graphing (e.g., 77). This score should be next to school week 1. In cell C20, type the number that represents the winter benchmark (months 4-6) of the skill you are graphing (e.g., 92). This score should be next to school week 18. In cell C38, type the number that represents the spring benchmark (months 7-10) of the skill you are graphing (e.g., 110). This score should be next to school week 36. Entering Benchmarks/Goals
In cells D3 through D38 type the number that represents the score the student achieved during that week of the school year. If a student was not assessed during a certain week of the school year, leave that cell blank*. Entering Student Scores
Entering Student Scores • *Do NOT enter zero (0) or a score of zero will be calculated into the trend line and interpreted as the student having read zero words correct per minute that week.
Highlight the data in columns C and D. Left click with mouse in cell C2. While holding down mouse, highlight columns C and D from row 2 through row 38. These will be your data points contributing to your graph. The selection should include the blank cells in column C. Creating a Graph
Left click “Insert” in the tool bar (typically in the top row) while columns C and D are still highlighted. Left click “Chart” in the drop-down menu. A “Chart Wizard” window will appear. Creating a Graph
In the Chart Wizard are two tabs. Make sure you are in the left tab, “Standard Types.” Next, you want to left click on the “Line” graph on the left side of your Chart Wizard. Creating a Graph
On the right side is “Chart sub-type.” Choose the graph with the description “Line with markers displayed at each data value.” This option is typically the first graph icon in the second row. Left click “Next” at the bottom of your Chart Wizard. Creating a Graph
The upper left tab says “Data Range.” The bottom half of that tab has your data range and series type. You want to select “Columns.” Creating a Graph
The top right tab is labeled “Series.” Left click on “Series” The top half of the “Series” tab has an icon of your graph. The bottom half shows you the label your data for the legend. Left click “Next” at the bottom of your Chart Wizard. Creating a Graph
The next options include tabs for Titles, Axes, Gridlines, etc. If you would like to title your chart, left click on the “Titles” tab. Enter a title (i.e., Diego’s Rate of Improvement) in the first box. Enter a description in the Category (X) Axis, which is your number of school weeks. Suggestion: School Week Enter a description in your Value (Y) Axis, which is the number of the skill you are graphing. Suggestion: Words Per Minute. Left click “Next” at the bottom of your Chart Wizard. Creating a Graph
Click on “Data Labels” Click to put a check mark next to “Value” Click on the “Next” Button Note: This can clutter your graph but provide useful info. Numerical Label to Data Points
Creating a Graph • Left click the bottom circle to choose “As object in: …” This will put the graph in the worksheet you have open. • Left click “Finish” in your Chart Wizard. This will place your graph in your Excel Document.
Creating a Graph • You can choose to have the graph created in a new worksheet within your Excel document. • Click next to “As new sheet…” • Label the worksheet by clicking on the tab at the bottom of the sheet and typing a name (i.e., Diego’s Graph) • Left click “Finish” in your Chart Wizard. This will place your graph in a new sheet in your Excel Document.
Resizing the Graph • You may resize the graph by clicking in any white space within your graph which will bring up squares at the corners of your graph. • You can put your mouse over these squares and drag the graph to a size you prefer. • Keep in mind that a large graph may not print easily.
Right click in the gray area and a drop down menu appears Click on “Format Plot Area” Coloring the Graph