Download

1 / 19
260 likes | 679 Views
Unit 6: Data Analysis . Z-Score. Z-Scores are measurements of how far from the center (mean) a data value falls. Ex: A man who stands 71.5 inches tall is 1 standardized standard deviation from the mean.

E N D
Unit 6: Data Analysis Z-Score
Z-Scores are measurements of how far from the center (mean) a data value falls. Ex: A man who stands 71.5 inches tall is 1standardized standard deviation from the mean. Ex: A man who stands 64 inches tall is -2standardized standard deviations from the mean.
Standardized Z-Score To get a Z-score, you need to have 3 things • Observed actual data value of random variable x • Population mean, also known as expected outcome/value/center • Population standard deviation, Then follow the formula.
Empirical Rule & Z-Score About 68% of data values in a normally distributed data set have z-scores between –1 and 1; approximately 95% of the values have z-scores between –2 and 2; and about 99.7% of the values have z-scores between –3 and 3.
Z-Score &Let H ~ N(69, 2.5) What would be the standardized score for an adult male who stood 71.5 inches? H ~ N(69, 2.5) Z ~ N(0, 1)
Z-Score &Let H ~ N(69, 2.5) What would be the standardized score for an adult male who stood 65.25 inches?
Comparing Z-Scores Suppose Bubba’s score on exam A was 65, where Exam A ~ N(50, 10) and Bubbette’s score was an 88 on exam B, where Exam B ~ N(74, 12). Who outscored who? Use Z-score to compare.
Comparing Z-Scores Heights for traditional college-age students in the US have means and standard deviations of approximately 70 inches and 3 inches for males and 165.1 cm and 6.35 cm for females. If a male college student were 68 inches tall and a female college student was 160 cm tall, who is relatively shorter in their respected gender groups? Male z = (68 – 70)/3 = -.667 Female z = (160 – 165.1)/6.35 = -.803
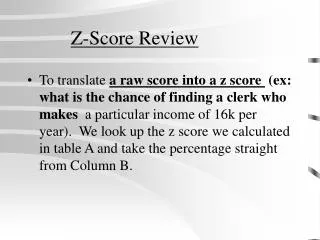
What if I want to know the PROBABILITY of a certain z-score? Use the calculator! Normcdf!!! 2nd Vars 2: normcdf( normcdf(lower, upper, mean(0), std. dev(1))
What if I know the probability that an event will happen, how do I find the corresponding z-score? • Use the z-score formula and work backwards! • Use the InvNorm command on your TI by entering in the probability value (representing the area shaded to the left of the desired z-score), then 0 (for population mean), and 1 (for population standard deviation).