Download

1 / 42
430 likes | 456 Views
Finance (Basics). Petr Malek Department of Finance Office 533 malek.petr@seznam.cz 99563@mail.muni.cz. Structure of lectures. 1.Introduction to finance - ok 2.Financial markets - 1/2 3.Banks and bank systems; 4.Other financial institutions; 5.Current value of money;

E N D
Finance (Basics) Petr Malek Department of Finance Office 533 malek.petr@seznam.cz 99563@mail.muni.cz
Structure of lectures • 1.Introduction to finance - ok • 2.Financial markets - 1/2 • 3.Banks and bank systems; • 4.Other financial institutions; • 5.Current value of money; • 6.Private finance; • 7.Investments; • 8.Corporate finance; • 9.International finance; • 10.International financial system; • 11.Macroekonomic and financial indicators and information; • 12.History of financial science; • 13.Latest trends on financial markets.
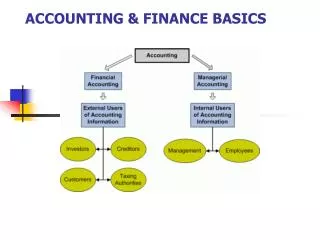
Lecture – Financial system and markets again I. • The financial system is complex, comprising many different types of private sector financial institutions, including banks, insurance companies, mutual funds, finance companies, and investment banks, all of which are heavily regulated by the government. • Function of financial market • Financial markets perform the essential economic function of channeling funds from households, firms, and government that have saved surplus funds by spending less than their income. • The principal lender- savers are households, business enterprises and the government • The most important borrower-spenders are businesses and the government
Financial system and markets again II. • In direct finance -borrowers borrow funds directly from lenders in financial markets by selling them financial instruments (securities) which are claims on the borrower‘s future income or assets. • Securities are assets for the person who buys them but they are liabilities for the individual or firm that sells them. • Financial markets are critical for producing an efficient allocation of capital (wealth), which contributes to higher production and efficiency for the overall economy.
Financial system and markets again III. • Well- functioning financial markets also directly improve the well-being of consumers by allowing them to time their purchases better. • Financial intermediaries are institutions – banks, that collect money - the savings of individuals and corporations and funnel them to firms that use the money to finance their investments.
Structure of Financial Markets • Debt and equity markets • Primary and secondary markets • Stock Exchanges and Over-the-Counter Markets • Money and Capital Markets • World Stock Markets
Debt and Equity Markets • The most common method is to issue a debt instrument, such as a bond or mortgage, which is contractual agreement by the borrower to pay the holder of the instrument fixed amounts at regular intervals (interests) until a specified date (the maturity date) when a final payment is made. • The maturity of a debt instrument is the number of years until that instrument‘s expiration date. • Short-term – maturity less than one year; • Intermediate-term, long-term. • The second method of raising funds is by issuing equities, such as common stock, which are claims to share in the net income. • Equities often make periodic payments (dividends) to their holders and are considered long-term securities bcse they have no maturity date.
Primary and Secondary markets • A primary market is a financial market in which new issues of a security, such as bond or a stock, are sold to initial buyers by the corporation or government agency borrowing the funds. • A secondary market is a financial market in which securities that have been previously issued can be resold.
Structure and Financial markets • Last lecture… • Debt and Equity Markets • Primary and Secondary Markets • Exchanges and Over-the-Counter Markets • Money and Capital Markets • World Stock Markets
Money Market – Common Money Market Instruments • Banker‘s Acceptance – A draft issued by a bank that will be accepted for payment, effectively the same as a cashier‘s check • Certificate of deposit – A time deposit at a bank with a specific maturity date; large-denomination certificates of deposits can be sold before maturity • Commercial paper – Unsecured promissory notes with a fixed maturity of one to 270 days; usually sold at a discount from face value • Eurodollar deposit – Deposits made in U.S. dollars at a bank or bank branch located outside the United States
Common money market instruments • Municipal notes – (in the U. S.) – Short-term notes issued by municipalities in anticipation of tax receipts or other revenues • Treasury bills – Short-term debt obligation of a national government that are issued to mature in three to twelve months (in the U.S.) • Money market mutual funds – pooled short maturity, high quality investments which buy money market securities on behalf of retail or institutional investors • Foreign Exchange swaps – Exchanging a set of currencies in spot date and the reversal of the exchange of currencies at a predetermined time in the future
Summary and Questions • Financial markets can be classified as a debt and equity markets, primary and secondary markets, exchanges a over-the-counter markets, and money and capital markets • An important trend in recent years is the growing internationalization of financial markets. Eurobonds, which are denominated in a currency other than that of the country in which they are sold, are now the dominant security in the international bond market. • Eurodollars, which are U.S. dollars deposited foreign banks, are an important source of funds for American banks. • Stock Exchange – work in groups
Summary • There are both organized and over-the –counter exchanges. Organized exchanges are distinguished by a physical building where trading takes place. The over-the-counter market operates primarilyover phone lines and computer links. Typically, larger firms trade on organizedexchanges and smaller firms trade in the over-the-counter market, though there are many exceptions to this rule. • Stocks are valued as the present value of the dividends. Unfortunately, we do not know very precisely what these dividends will be. This introduces a great deal of error to the valuation process.
Are Financial Markets efficient? • Theoretically, the efficient market hypothesis should be a powerful tool for analyzing behavior in financial markets • The efficient market hypothesis • To more fully understand how expectations affect securities prices, we need to look at how information in the market affects these prices • The efficient market hypothesis (also referred to as the theory of efficient capital markets), which states that prices of securities in financial markets fully reflect all available information. • The efficient market hypothesis views expectations as equal to optimal forecasts using all available information.
The efficient market hypothesis • Current prices in a financial market will be set so that the optimal forecast of a security‘s return using all available information equals the security‘s equilibrium return. • A security‘s price fully reflects all available information in an efficient market • In an efficient market, all unexploited profit opportunities will be eliminated • Not everyone in an financial market must be well informed about a security or have rational expectations for its price to be driven to the point at which the efficient market condition holds.
Random walk • The term random walk describes the movements of a variable whose future changes cannot be predicted (are random) because given today‘s value, the variable is just as likely to fall as to rise. • An important implication of the efficient market hypothesis is that stock prices should approximately follow a random walk; that is just future changes in stock prices should, for all practical purposes, be unpredictable • The random-walk implication of the efficient market hypothesis is the one most commonly mentioned in the press because it is the most readily comprehensible to the public
Evidence against market efficiency - Anomalies • Small-firm Effect • One of the earliest reported anomalies in which the stock market did not appear to be efficient is called the small firm effect. • Many empirical studies have shown that small firms have earned abnormally high returns over long periods of time, even when the greater risk for these firms has been taken into account (Reinganum – 1983, Ritter – 1988, Roll – 1988)
Anomalies – January Effect • Over long periods of time, stock prices have tended to experience an abnormal price rise from December to January that is predictable and hence inconsistent with random-walk behavior • This so called January effect seems to have diminished in recent years for shares of large companies but still occurs for shares of small companies
Anomalies – Market Overreaction • Recent research suggests that stock prices may overreact to news announcements and that the pricing errors are corrected only slowly (De Bondt and Thaler – 1987) • When corporations announce a major change in earnings, say, a large decline, the stock price may overshoot, and after an initial large decline, it may rise back to more normal levels over a period of several weeks
Anomalies – Excessive Volatility, Mean Reversion • Excessive volatility - a closely related phenomenon to market overreaction is that stock market appears to display excessive volatility; that is, fluctuations in stock prices may be much greater than is warranted by fluctuations in their fundamental value. • Mean reversion – some researchers have also found that stock returns display mean reversion: Stocks with low returns today tend to have high returns in the future, and vice versa
Anomalies • New Information is not always immediately incorporated into stock prices • Although it is generally found that stock prices adjust rapidly to new information, as is suggested by the efficient market hypothesis, recent evidence suggests that, inconsistent with the efficient market hypothesis, stock prices do not instantaneously adjust to profit announcements.
Summary • The efficient market hypothesis states that current security prices will fully reflect all available information because in an efficient market, all unexploited profit opportunities necessary for a financial market to be efficient does not require that all market participants be well informed
Summary • The evidence on the efficient market hypothesis is quite mixed. Early evidence on the performance of investment analysts and mutual funds, whether stock prices reflect publicly available information, the random-walk behavior of stock prices, or the success of so-called technical analysis, was quite favorable to the efficient market hypothesis. • However, in recent years, evidence on the small firm effect, the January effect, market overreaction, excessive volatility, mean reversion, and that new information is not always incorporated into stock prices suggests that the hypothesis may not always be entirely correct. • The evidence seems to suggest that the efficient market hypothesis may be reasonable starting point for evaluating behavior in financial markets but may not be generalizable to all behavior in financial markets.
Financial analysis • Fundamental analysis • Technical analysis • Psychological analysis
Technical analysis • Technical analysis is a financial markets technique that claims the ability to forecast the future direction of security prices through the study of past market data, primarily price and volume. • Technical analysts seek to identify price patterns and trends in financial markets and attempt to exploit those patterns. • Technicians use various methods and tools, the study of price charts primary. • They especially search for archetypal patterns, such as a well-known head and shoulders reversal pattern, and also study such indicators as pric, volume and moving averages of the pric. Many technical analysts also follow indicators of investor psychology (market sentiment).
History and Principles of TA • Dow Jones Theory Modern technical analysis (19th century) • Ralph Nelson Elliot • William Delbert Gann • Technicians say that a market‘s price reflects all relevant information, so their analysis looks more at „internals“ than at „externals“ such as news events. • Price action also tends to repeat itself because investors collectively tend toward patterned behavior - hence technicians‘ focus on identifiable trends and conditions
Technical analysis • History tends to repeat itself • Prices move in trends • Systematic trading • Neural networks • Rule-based trading • Combination with other Market forecast methods
Technical analysisCharting terms and indicators • Concepts – Elliot wave principle, Fibonacci, Gann, Momentum, Point and figure charts • Overlays (o. are generally superimposed over the main price chart) • Resistance – an area that brings on increased selling • Support – an area that brings on increased buying • Breakout – when a price passes through and stays above an area of support and resistance • Trend line – a sloping line of support or resistance • Channel – a pair of paralleltrend lines • Moving average –lags behind the price action but filters out short term movements
Technical analysisCharting terms and indicators • Price-based indicators • Accumulation/distribution index – based on the close within the day‘s range • Commodity channel index – identifies cyclical trends • MACD • Relative strength indicator – oscillator showing price strength • Stochastic oscillator – close position within recent trading range • Trix – an oscillator showing the slope of a triple-smoothed exponential moving average, developed in the 1980s by Jack Hutson • Volume based indicators • Money flow – the amount of stock traded on days the price went up • OBV – the momentum of buying and selling stocks
Technical analysisChart technique • A chart pattern is a pattern that is formed within a chart when prices are graphed. In stock and commodity markets trading, chart pattern studies play a large role during technical analysis. • Candlestick chart (line chart, bar chart)…developed by Japan rice trader Homma Munehisa • Point and figure chart • Kagi chart
Market trends • Primary market trends (optimism vs. pessimism) • Bull market • Bear market • Secondary market trends • Short-term changes in price direction against a primary trend. • It usually last between a few weeks and a few months
Stock Exchanges • A Stock Exchange, securities exchange or bourse (burza) is a corporation or mutual organization which provides „trading“ facilities for stock brokers and traders, to trade stocks and other securities. • Stock Exchanges also provide facilities for the issue and redemption of securities as wellas other financial instruments and capital events including the payment of income and dividends. • The initial offering of stocks and bonds to investors is by definition done in the primary market and subsequent trading is done in the secondary market.
Stock Exchange – history and role • History • In 11th century • The role of stock exchanges • Raising capital • Mobilizing savings for investment • Facilitating company growth • Redistributing of wealth • Corporate governance • Creating investment opportunities for small investors • Government capital-raising for development projects • Barometer of the economy
Major Stock Exchanges • NYSE • Tokio Stock Exchange • Deutsche boerse • Hong Kong Stock Exchange • London Stock Exchange • Bombay Stock Exchange • Nasdaq (OTC)
NYSE • The origin of the NYSEcan be traced to May 17, 1792, when the Buttonwood agreement was signed by 24 stock brokers outside of 68 Wall street in NY under the Buttonwood tree. • THE NYSE is a stock exchange based in NY, it is largest stock exchange in the world by volume of listed securities. • The NYSE is operated by NYSE Euronext, which was formed by NYSE‘s merger with the fully electronic stock exchange Euronext. • The NYSE gives an efficient method for buyers and sellers to trade shares of stock in companies registered for public trading. • The NYSE was closed from September 11 until September 17, 2001.
The world major indices • NASDAQ • DJIA • SaP 500 • DAX • Nikkei • Hang Seng Index
DJIA (DJIA=Σp/d) • The Dow Jones Industrial Average (NYSE:DJIA, DOW 30) is one of several stock market indices, created by 19th century Wall street journal editor and Dow Jones and Co. co-founder Charles Dow. • It is the second oldest U.S. market index, after the Dow Jones Transportation Average. • The average is computed from the stock prices of 30 of the largest and most widely held public companies in the United States. • Calculation – to calculate the DJIA, the sum of the prices of all 30 stocks is divided by a divisor, the DJIA divisor. • The divisor is adjusted in case of splits, spinoffs or similar structural changes, to ensure that such events do not in themselves alter the numerical value of the DJIA. • The initial divisor was the number of component companies (arithmetic average). The present divisor is less than one.