Download
1 / 34
350 likes | 359 Views
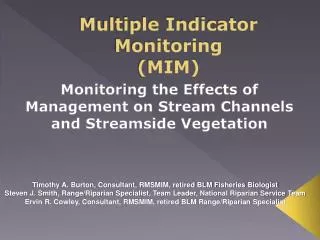
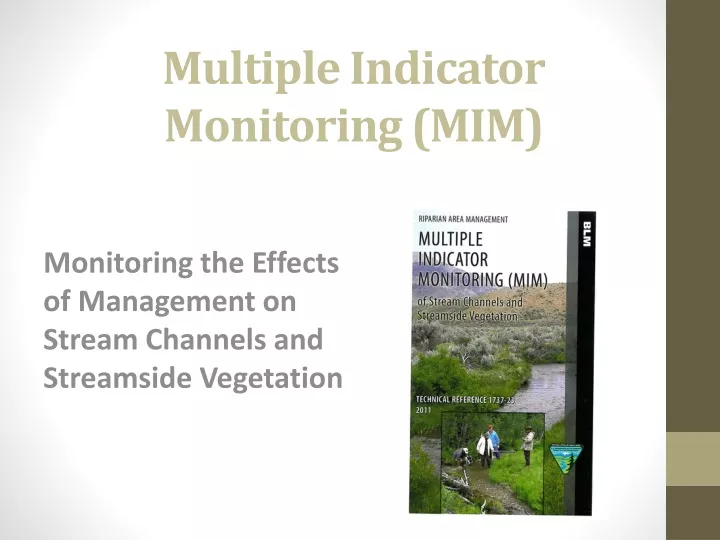
Multiple Indicator Monitoring (MIM). Monitoring the Effects of Management on Stream Channels and Streamside Vegetation. Outline. 1. Introduction - overview of MIM 2. Background – history of MIM development 3. MIM content and procedures – overview of protocol. MIM Overview.

E N D
Multiple Indicator Monitoring(MIM) Monitoring the Effects of Management on Stream Channels and Streamside Vegetation
Outline 1. Introduction - overview of MIM 2. Background – history of MIM development 3. MIM content and procedures – overview of protocol
Many sites are remote – much of the time allocated to monitoring is used just getting to the sites
Therefore, how can we be efficient with our time and minimize the use of costly, time-consuming methods?
Solution… • Combine short-term monitoring indicators such as stubble height, bank alteration, and woody browse use with long-term monitoring metrics such as pool volumes, stream width, and, vegetation metrics.
University of Idaho Stubble Height Review Team Reviewed the use of “stubble height”, a short-term indicator of grazing effects, they concluded… “Emphasis should be placed on long-term monitoring of trend to determine whether resource management objectives are being met” Stubble Height is a grazing use indicator, NOT a resource objective. Stubble height research site – Stanley Creek, ID
Original Idea Since most of the cost of monitoring is just getting there… • Be efficient: Do more than one indicator at the same time… • Be effective: Collect short- and long-term indicators at the same time and location… • Relationships • Cause-and-effect • Inform adaptive management
To be effective… • Monitoring must be able to detect change • Monitoring must have statistical rigor • Precision – repeatability (agreement between repeated observations). • Addressed by using & testing rule set with trained observers • Accuracy– reasonable level of confidence in predicting the true value • Addressed by collecting appropriate sample size
Among all of the existing indicators, which should we use? • Direct measures (temperature and humidity) • Canopy closure - over stream and riparian • Seral stage/structural complexity of riparian vegetation • Fish/wildlife distribution, abundance, connectivity • Native riparian community mosaic composition regime • Soil quality - moisture, compaction, organics • Presence/absence of a defined stream channel, width-to-depth ratio, frequency of large pools, longitudinal profiles, residual pool , depth, bank angles, shore depth, substrate, and so forth • Flood-plain interactions/connectivity • Number of dams and diversions, acres of reservoirs • Animal Unit Months (cattle and pack stock)a • Ground-water condition • Habitat mapping (fast/slow water) • Width-to-depth ratio, frequency of large pools, longitudinal profiles, residual pool depth, bank angles, shore depth, substrate, and so forth • Flood-plain interactions/connectivity • Number of dams and diversions, acres of reservoirs • Animal Unit Months (cattle and pack stock) a • Mining history/extent • Root density/bank stability• Hydrographs - peak flow, frequency, and so forth • Watershed/near-stream road density • Elongation of stream into ditches (length) • Number of culverts and stream crossings • Culvert failure rate • Number of dams and diversions, acres of reservoirs • Length of perennial stream (ratio to intermittent)a • Lake/pond water level • Mining history/extent • Ground-water condition • Soil quality - compaction, cover, organics • Fragmentation of riparian vegetation - high contrast • Fragmentation of riparian vegetation - low contrast • Seral stage/structural complexity of riparian • Native riparian community mosaic, • In-stream/lake aquatic vegetation • Fish/wildlife populations parameters • Fish/wildlife distribution, abundance, connectivity • Timber harvest history • Location/size of recreation sites • Location/size of other disturbance • Chemical and nutrient content of water • Invertebrate community structure • Instream-channel carbon load • Fire frequency • Primary productivity/algal community • Native riparian community mosaic, composition • Number of reported toxic spills - type and quantity • Water quality - direct measures • Sublethal/mortality effects on vertebrates • Invertebrate community structure • Seral stage/structural complexity of riparian • Number of culverts and stream crossings • Fish/wildlife population • Fish/wildlife distribution, abundance, connectivity • Genetic diversity/similarity • Fish health • Angler/hunter surveys • Community composition/integrity metrics • Special habitats distribution and abundance • Fish stocking history • Instream - channel sediment measures • Channel morphology • Slope erosion indicators • Frequency, distribution, arrangement of LWD • Large tree density/diameter • Seral stage/structural complexity of riparian • Slope erosion indicators • Number of dams and diversions, acres of reservoirs • Water Temperature Direct measures • Canopy closure - over stream and riparian • Presence/distribution of special thermal habitats • Fish/wildlife distribution, abundance, connectivity • Length of perennial stream, ratio to intermittent
What should we monitor? • “Long-term monitoring of vegetation composition on the greenline, stream bank stability and regeneration of woody species are the true measures of whether riparian management objectives are being met.” • “Annual indicators, such as stubble height, are only useful for interpretation of why trend is not satisfactory.”
Indicators should address/ answer key questions regarding an issue ISSUE: Riparian conditions are currently not meeting resource objectives KEY QUESTION: What effects are livestock grazing having on the riparian vegetation and the stream environment? Short-Term: What levels of use are actually occurring in-season and what is the condition post-season? Short-Term Indicators - Stubble height, bank alteration, woody browse Long-Term: What are the trends in riparian and stream conditions? Are we meeting objectives? Long-Term Indicators - Greenline vegetation composition, GGW, Bank stability/Cover, substrate size composition, pool volumes
Measure both Short and Long Term Indicators Together • To improve efficiency, reduce costs and time to sample • To allow statistical comparisons between short-and long-term indicators • To identify which indicator(s) best reflect grazing (and other) influences
Therefore, there is a need to have a protocol that: • Addresses multiple indicators at fixed location; • Is efficient, fast, with electronic data collection & summary ; • Is effective (measures most important indicators that are the most useful in detecting change); • Yields statistically acceptable results given realistic time constraints; • Uses existing protocols to extent possible; • Provides useful data to inform management ; MIM was designed to address each of these issues
MIM Technical Reference 1737-23: • Instructions for locating the appropriate Designated Monitoring Area (DMA) • Instructions for locating the greenline plot locations (from which all data are collected) • Procedures for 3 short term indicators: • Stubble Height, Streambank Alteration, Woody Use • Procedures for 7 long-term indicators: • Greenline Vegetation, Woody Species age/height class, Stability, Greenline to Greenline Width, Substrate Size, Pool depth • An automated format (Excel) for electronic data collection and summary
MIM is most useful for: • Small streams (<10 meters wide – wadable) • Snowmelt dominated & spring-fed streams • Monitoring the effects of grazing – however, the long-term indicators described in MIM are useful for monitoring changes that result from other management activities
Why these indicators? • Measurable • Repeatable • Applicable to key elements of stream functionality • Reflect effects of riparian & channel disturbance • Tested for precision and accuracy • Best reflect the influences of land management
Plots placed on the “Greenline” The first perennial vegetation that forms a lineal grouping of community types on or near the water’s edge. (Winward 2000) Lineal Groups
Significance of the Greenline The “Greenline” Decreasing access to water table Riparian plants Upland plants Water Table Stream Depth to groundwater increases with distance from the greenline. Hydric species nearest the stream with mesic and xeric plants increasing with distance from the stream.
Why on the Greenline? • Vegetation at the greenline resists lateral forces of erosion. • Plant types at the greenline play a critical role in buffering the forces of water. • Plant types at the greenline reflect influence of water and can recover quickly after disturbance, making it the first location in the riparian zone to show change. • Over time, streams develop a balance between buffering by vegetation & erosion by water. This balance can be disrupted by anthropogenic disturbance & is evidenced by stability changes.
Why on the Greenline? • It may be, and is often located near the bankfull stage, but encroachment into the active channel, or channel incision resulting in the greenline above bankfull stage are of interest in monitoring. • Testing (GGW) indicates good observer agreement (precision) in locating the greenline. In some streams, the lack of bankfull indicators makes precision in it’s location problematic.
Located by pacing within the channel ▲ ▲ Flow Frame placement on Greenline • At least 110 meters (361 feet) both sides of the stream • > 40 plots on each side, depending on site variability (estimated in data entry module) • Substrate is collected at every other plot across the channel
QUADRAT PLOTS • Stubble ht, 2. bank alteration, 3. woody browse, 4. greenline veg, 5. bank stability, 6. woody regeneration – on the greenline CROSS SECTION 7. Greenline-Greenline Width & 8. Substrate – in the cross- section- 9. Thalweg profile (new)
Systematic Sampling “Useful for any type of sampling as long at the first sampling unit is selected randomlyand the sampling units are far enough apart to be considered independent.” (Elzinga et al.)
Why Systematic Sampling? “One of the principal advantages of systematic sampling is the fact that it enables the investigator to sample evenly across a whole area. This results in good interspersion of sampling units throughout the area containing the target population. Systematic sampling is more efficient than simple random sampling.” (Elzinga et al.)
Random - Systematic Start Head stake & photo directions Direction of flow
Field PDA – Data Entry and Analysis Modules - Fast data handling
Automated MIM Metrics Annual Indicators • Median & Mean Stubble Height • % Streambank Alteration • % Woody Browse Use • Mean Stubble Height for Dominant Key Species • % Stable Streambanks • % Covered Streambanks • % Saplings and Young Woody Vegetation • % Mature Woody Vegetation (and dead) • Vegetation Erosion Resistance (Greenline Stability Rating) • % Hydric Vegetation • % Hydric Herbaceous • Mean Greenline-Greenline Width (GGW) • Ecological Status • Wetland Rating • Substrate Composition (D16, D50, D84) • Pool frequency, pool residual depth Long-Term Indicators