Download
1 / 46
470 likes | 933 Views
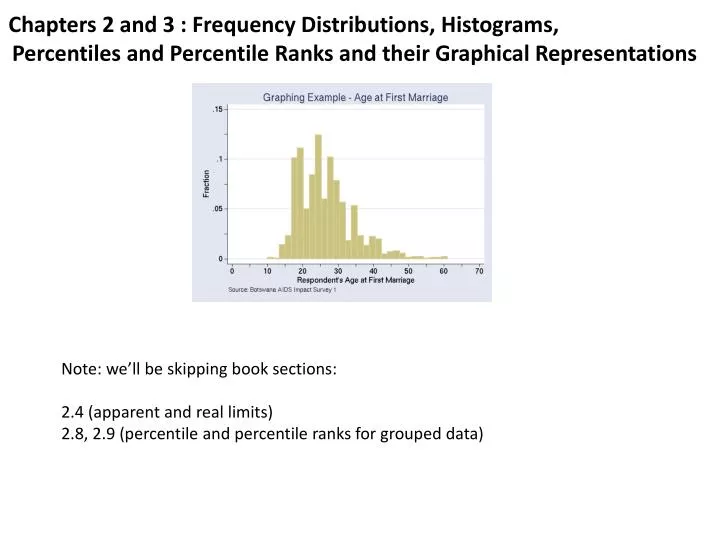
Chapters 2 and 3 : Frequency Distributions, Histograms, Percentiles and Percentile Ranks and their Graphical Representations. Note: we’ll be skipping book sections: 2.4 (apparent and real limits) 2.8, 2.9 (percentile and percentile ranks for grouped data).

E N D
Chapters 2 and 3 : Frequency Distributions, Histograms, Percentiles and Percentile Ranks and their Graphical Representations Note: we’ll be skipping book sections: 2.4 (apparent and real limits) 2.8, 2.9 (percentile and percentile ranks for grouped data)
Chapter 2: Frequency Distributions, Histograms, Percentiles and Percentile Ranks How can we represent or summarize a list of values? frequency distribution: shows the number of observations for the possible categories or score values in a set of data. Can be done on any scale (nominal, ordinal, interval, or ratio). Often represented as a bar graph (Chapter 3). Example of a frequency distribution for nominal scale data: 2008 Auto sales by country: Japan: 11,563,629 China: 9,345,101 US: 8,705,239 Germany: 6,040,582 South Korea: 3,806,682 Brazil: 3,220,475
Car sales drawn as a histogram 12 10 8 Japan: 11,563,629 China: 9,345,101 US: 8,705,239 Germany: 6,040,582 South Korea: 3,806,682 Brazil: 3,220,475 Car Sales in 2008 (millions) 6 4 2 0 Japan China US Germany South Korea Brazil
This histogram shows the proportion of members for each category. Distribution of all M&M's.
Ice Dancing , compulsory dance scores, 4 Winter Olympics Making histograms from interval and ratio data We need to bin the raw scores into a set of class intervals. How do we decide these class intervals? Be sure the intervals don’t overlap, have the same width, and cover the entire range of scores. Use around 10 to 20 intervals. Use a ‘sensible’ width (like 5, and not 2.718285) Make the lower score a multiple of the width (e.g. if the width is 5, a lower score should be 50, not 48) If a score lands on the border, put it in the lowerclass interval.
Ice Dancing , compulsory dance scores, Winter Olympics Let’s use a class interval width of 5 points, with a lowest score of 55. Class Intervals Frequency (f) 1 2 2 3 1 2 5 2 2 1 1 1 110-115 105-110 100-105 95-100 90-95 85-90 80-85 75-80 70-75 65-70 60-65 55-60 n=23 Count the number of scores in each bin to get the frequency
Histogram of Ice Dancing Scores (frequency) Class Intervals Frequency (f) 1 2 2 3 1 2 5 2 2 1 1 1 110-115 105-110 100-105 95-100 90-95 85-90 80-85 75-80 70-75 65-70 60-65 55-60 5 4 3 Frequency 2 1 0 55 60 65 70 75 80 85 90 95 100 105 110 115 Ice Dancing Score
Relative frequency Relative frequency (%) Relative frequency (prop) Class Intervals Frequency (f) .0435 .0870 .0870 .1304 .0435 .0870 .2174 .0870 .0870 .0435 .0435 .0435 1 2 2 3 1 2 5 2 2 1 1 1 4.35 8.70 8.70 13.04 4.35 8.70 21.74 8.70 8.70 4.35 4.35 4.35 110-115 105-110 100-105 95-100 90-95 85-90 80-85 75-80 70-75 65-70 60-65 55-60 n=23 Divide by the total number of scores to get relative frequency in proportion Then multiply by 100 to get relative frequency in percent
Relative frequency histogram of Ice Dancing Scores (frequency) Relative frequency (%) Class Intervals 25 110-115 105-110 100-105 95-100 90-95 85-90 80-85 75-80 70-75 65-70 60-65 55-60 4.35 8.70 8.70 13.04 4.35 8.70 21.74 8.70 8.70 4.35 4.35 4.35 20 15 Relative Frequency (%) 10 5 0 55 60 65 70 75 80 85 90 95 100 105 110 115 Ice Dancing Score
Choosing your class intervals can have an influence on the way your histogram looks 7 5 6 4 5 3 Frequency Frequency 4 3 2 2 1 1 0 0 60 70 80 90 100 110 120 60 80 100 Ice Dancing Score Ice Dancing Score 3 2 2 Frequency Frequency 1 1 0 0 60 80 100 60 80 100 Ice Dancing Score Ice Dancing Score interval width 10 interval width 5 interval width 3 interval width 1
5 5 4 3 Frequency 4 2 1 3 Frequency 0 60 70 80 90 100 110 Ice Dancing Score 2 5 1 4 3 Frequency 2 1 0 0 60 80 100 60 70 80 90 100 110 Ice Dancing Score Ice Dancing Score These three graphs have the same class intervals on the same scores!
When possible, include zero on your y-axis. Not like this
When possible, include zero on your y-axis: When possible, include zero on your y-axis. Like this 8 6 Not like this Enrollment (Millions) 4 2 0 As of March 27 March 31 Goal
“Fox News Apologizes For Obamacare Graphic, Corrects Its 'Mistake‘”
Percentile ranks and percentile point: Percentile Point: A point on the measurement scale below which a specific percentage of scores fall. Percentile Rank: The percentage of cases that fall below a given point on the measurement scale. Percentile ranks are always between zero and 100.
Growth charts convert percentile points to percentile ranks At 30 mos. P95 = 36lbs
Percentile ranks and percentile point: What is the percentile rank for a percentile point of 100? In other words, What proportion of scores fall below a score of 100? 78.26% of the scores fall below 100 The number 78.26 is the percentile rank The number 100 is the corresponding percentile point We write P78.26 =100 Ice Dancing , compulsory dance scores, Winter Olympics
Percentile ranks and percentile point: 21.74% of the scores are below 75 or P21.74 = 75 or 100-21.74=78.26% of the scores are above 75. Ice Dancing , compulsory dance scores, Winter Olympics
The Cumulative Percentage Curve 100 90 80 70 60 Cumulative Percentage 50 40 30 20 10 0 60 65 70 75 80 85 90 95 100 105 110 115 Ice Dancing Score 21.74% of the scores fall below a score of 75 The number 21.74 is the percentile rank The number 75 is the corresponding percentile point We write P21.74 = 75
The Cumulative Percentage Curve 100 90 80 70 60 Cumulative Percentage 50 40 30 20 10 0 60 65 70 75 80 85 90 95 100 105 110 115 Ice Dancing Score 78.26% of the scores fall below a score of 100 The number 78.26is the percentile rank The number 100 is the corresponding percentile point We write P78.26 = 100
The Cumulative Percentage Curve 100 90 80 70 60 Cumulative Percentage 50 40 30 20 10 0 60 65 70 75 80 85 90 95 100 105 110 115 Ice Dancing Score 50% of the scores fall below a score of about 84 The number 50 is the percentile rank The number 84 is an estimate of the percentile point We write P50 = 84
Cumulative frequency distribution What is the percentile point for a percentile rank of 21.74%? Answer: 75 points (21.75% of the scores fall below 75) Ice Dancing , compulsory dance scores, Winter Olympics
Cumulative frequency distribution Cumulative frequency Cumulative percent Cumulative proportion Class Intervals Frequency (f) 1 2 2 3 1 2 5 2 2 1 1 1 110-115 105-110 100-105 95-100 90-95 85-90 80-85 75-80 70-75 65-70 60-65 55-60 23 22 20 18 15 14 12 7 5 3 2 1 1.00 .96 .87 .78 .65 .61 .52 .30 .22 .13 .09 .04 100 96 87 78 65 61 52 30 22 13 8 4 What is the percentile point for a percentile rank of 50? (Or what is P50?) We know it’s between 80 and 85, since 52% fall below 85 and 30% fall below 80. Ice Dancing , compulsory dance scores, Winter Olympics
Here’s how to calculate the percentile rank for each raw score: note this is different from the book! Rank order Score Subtract 1/2 Divide by n (23) Multiply by 100 The percentile point for a percentile rank of 50 is 84.58 ( P50 = 84.58) Ice Dancing, compulsory dance scores, Winter Olympics
Here’s how to calculate the percentile rank for each raw score: Rank order Subtract 1/2 Divide by 23 Multiply by 100 Score The percentile point for a percentile rank of 80 is 100.6 (P80 = 100.6) Ice Dancing , compulsory dance scores, Winter Olympics
How do we calculate the percentile point for all the other ranks? Example: What is the percentile point for the percentile rank of 90%? Score Rank order Subtract 1/2 Divide by 23 Multiply by 100 We know it’s between 106.6 and 108.55 In fact, it’s ¼ of the way between 106.6 and 108.55 (90-89)/(93-89) = 1/4 That means that P90 = 106.6 + 1/4(108.55-106.6) = 107.09
How do we calculate the percentile point for other ranks? Example, what is the percentile point for the percentile rank of P75? Rank order Subtract 1/2 Divide by 23 Multiply by 100 Score We know it’s ¾ of the way between 96.67 and 97.38 96.67 + 3/4(97.38-96.67) = 97.2
How do we calculate the percentile point for other ranks? Example, what is the percentile score for the percentile rank of P25? Score Rank order Subtract 1/2 Divide by 23 Multiply by 100 We know it’s 1/4 of the way between 76.73 and 79.31 76.73 + 1/4(79.31-76.73) = 77.37
General formula for calculating percentile points: Example, what is the percentile point for the percentile rank of 81? Rank order Subtract 1/2 Divide by 23 Multiply by 100 Score Make a chart like the one above Find the two rows that fall above and below the percentile rank Let PH and PL be the high and low cumulative percentiles (85 and 80 in this example) Let SH and SL be the high and low scores (103.33 and 100.06 in this example) If p is the percentile rank (81 in our example), then the percentile point is:
Going the other way: from percentile ranks to percentile points Example: What is the percentile rank for the percentile point of 103.33? Rank order Subtract 1/2 Divide by 23 Multiply by 100 Score This is easy, since 103.33 is one of the scores. The percentile rank is 85%. 85% of the scores fall below 103.33
Going the other way: from percentile ranks to percentile points Example: What is the percentile rank for the percentile point of 100? Rank order Subtract 1/2 Divide by 23 Multiply by 100 Score This is not as easy, since 100 is not one of the scores. We do know that it is between 76 and 80. In fact, we know it must be really close to 80, since P80 is 100.06 Here’s how to do it. After finding the two rows that bracket the percentile point, if S is the percentile point, then the percentile rank is: 79.91% o the scores fall below 100
Another Example: integer valued data Scores on Professor Flans’ Midterm (n = 20) We’ll choose a class interval width of 3. An odd number for width is good for integer data because the middle value will be a whole number. Raw Test Scores Remember, scores that land on the border are assigned to the lower class interval. So 85 lands in the interval 82-85.
Bins labeled by the centers of the class intervals 5 4 3 Frequency 2 1 0 60 63 66 69 72 75 78 81 84 87 90 93 96 99 Test Score
You can also show the whole interval on the x-axis labels 5 4 3 Frequency 2 1 0 58-61 61-64 64-67 67-70 70-73 73-76 76-79 79-82 82-85 85-88 88-91 91-94 94-97 97-100 Test Score
The Cumulative Percentage Curve for Professor Flans’ Midterm Estimate the percentile point for a percentile rank of 50% 100 90 80 70 60 Cumulative Frequency (%) 50 40 30 20 10 0 61 64 67 70 73 76 79 82 85 88 91 94 97 100 Test Score About 50% of the scores fall below 82. (So P50 is about 82)
Estimating percentile points and percentile ranks from the cumulative percentage curve Estimate the percentile point for a percentile rank of 90% 100 90 80 70 60 Cumulative Frequency (%) 50 40 30 20 10 0 61 64 67 70 73 76 79 82 85 88 91 94 97 100 Test Score 90% of the scores fall below a score of about 92. (P90 is about 92)
Calculating percentile points from raw data. What is the percentile point for a percentile rank of 50%? Test score Rank order Subtract 1/2 Divide by 20 Multiply by 100 It’s between 82 and 83 P50 = 82.5
Calculating percentile points from raw data. What is the percentile point for a percentile rank of 90%? Test score Rank order Subtract 1/2 Divide by 20 Multiply by 100 It’s between 92 and 93 It’s exactly halfway between 92 and 93
Going the other way: from percentile ranks to percentile points Example, what is the percentile rank for the percentile point of 90? Test score Rank order Subtract 1/2 Divide by 23 Multiply by 100 It’s between 77.5 and 82.5 81.25% of the scores fall below 90 points
More stuff about frequency distributions: Frequency polygon Frequency histogram 5 5 4 4 3 3 Frequency Frequency 2 2 1 1 0 0 60 63 66 69 72 75 78 81 84 87 90 93 96 99 60 63 66 69 72 75 78 81 84 87 90 93 96 99 Test Score Test Score
Properties of frequency distributions ‘normal’ or bell-shaped positively skewed Negatively skewed
Example of a negatively skewed distribution 40 35 30 25 Frequency 20 15 10 5 0 300 350 400 450 500 550 600 650 700 750 800 GRE quant scores
Example of positively skewed distribution: Household annual income
Household income distribution as of 2006: • P0-89 (bottom 90%) — income below $104,696 (average income, $30,374*) • P90-100 (top 10%) — income above $104,696 (average income, $269,658*) • P90-95 (next 5%) — income between $104,696 and $148,423 (average income, $122,429*) • P95-99 (next 4%) — income between $148,423 and $382,593 (average income, $210,597*) • P99-100 (top 1%) — income above $382,593 (average income, $1,243,516*) • P99.5-100 (top 0.5%) — income above $597,584 (average income, $2,022,315*) • P99.9-100 (top 0.1%) — income above $1,898,200 (average income, $6,289,800*) • P99.99-100 (top .01%) —income above $10,659,283 (average income, $29,638,027*) So the ‘top 1%’ can be described as: P99 = $382,593 http://www.wealthandwant.com/issues/income/income_distribution.html
0 20 40 60 80 100 Scores 0 20 40 60 80 100 Scores Two (of many) ways that frequency distributions differ Shift in central tendency Shift in variability