Download
1 / 16
160 likes | 236 Views
Minimum Sample Size ----------- Proportions on the TI. Section 12.1.2. Starter 12.1.2.

E N D
Minimum Sample Size-----------Proportions on the TI Section 12.1.2
Starter 12.1.2 Some people think that chemists are more likely than others to have female children. Perhaps they are exposed to chemicals that cause this. Between 1980 and 1990 in Washington state, 555 children were born to chemists. Of these births, 273 were girls. During this period, 48.8% of all births in Washington were girls. Is there evidence that the proportion of girls born to chemists is higher than normal? Write hypotheses, calculate the sample proportion, perform a test, and write your conclusion.
Today’s Objectives • Students will use TI to perform a hypothesis test for proportions. • Students will use TI to form a confidence interval for proportions. • Students will calculate the minimum sample size needed to achieve a confidence interval with desired margin of error. California Standards: • 18.0 Students determine the P- value for a statistic for a simple random sample from a normal distribution. • 20.0 Students are familiar with the t distributions and t test and understand their uses.
Hypothesis tests for proportion on the TI • Select Stat : Tests / 1-PropZTest • Enter the null hypothesis as po • Enter the number of success as x • Enter the sample size as n • Choose the appropriate alternative hypothesis • Calculate to find z and p • Note: p = probability, p-hat = sample proportion • Write a sentence that states your conclusion
Example A coin is flipped 4040 times. Heads comes up 2048 times. Is the coin fair? State hypotheses, carry out the test on the TI, and write a sentence that states your conclusion about the fairness of the coin.
Example Solution • Ho: p = .5 Ha: p ≠ .5 • TI gives z = .88, p = .38 • Conclusion: There is not enough evidence (p = .38) to conclude that the coin is unfair. • Note that the calculator multiplied the tail area by 2 automatically, so we get the same result as yesterday.
Starter Redux • Use the TI to perform the hypothesis test in today’s starter. • What is po and what Ha will you use? • Po = .488 • Ha: prop > po • You should again get a p-value of 43% and fail to reject the null.
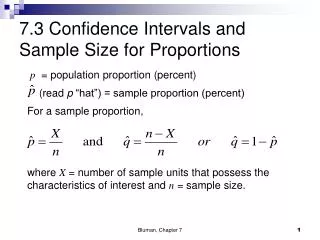
Confidence Intervals for proportion on the TI • Select Stat : Tests / 1-PropZInt • Enter the number of success as x • Enter the sample size as n • Choose the appropriate C-Level • Calculate to find the interval • Write a sentence that states your conclusion
Example continued • For the same coin flip problem (2048 heads in 4040 tosses), state a 95% confidence interval for the true proportion of heads on this coin. • TI gives (.49151, .52235) • Conclusion: We are 95% confident that the true proportion of heads is between 49% and 52% • Note that this INCLUDES 50%, our definition of fair
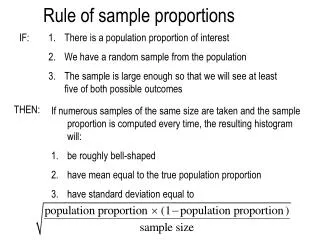
Choosing the sample size • Calculate margin of error for proportions just like margin of error for means • m = z*(S.E.) = • But S.E. depends on p-hat which you don’t know yet • So guess! Call the guess p* • Two ways to guess: • Base p* on history or a pilot study • Arbitrarily let p* = .5
Formula for sample size n • Replace m with desired margin of error • For example m = .03 for plus/minus 3% • Solve for n
Example You want to conduct a poll to estimate support for a candidate with 95% confidence. You want results accurate to within 3%. How large a sample do you need? (Let’s use p* = .5) Recall that Table C says 95% z* = 1.960
Follow-up • And that’s what they really do on large national polls • They only need a little over 1000 in the sample if valid sampling methods are used. • The z* came from the 95% confidence level. • The p* and q* came from an assumption. • What if p* ≠ .5? How does that change sample size needed? • Try a new assumption of p* = .4 and see what that does to the previous calculation. • You should get n = 1025, so sample size decreased. • If we let p* = .6 instead of .4, how does the answer change? • What conclusion do you draw?
Today’s Objectives • Students will use TI to perform a hypothesis test for proportions. • Students will use TI to form a confidence interval for proportions. • Students will calculate the minimum sample size needed to achieve a confidence interval with desired margin of error. California Standards: • 18.0 Students determine the P- value for a statistic for a simple random sample from a normal distribution. • 20.0 Students are familiar with the t distributions and t test and understand their uses.
Homework • Read pages 669 – 674 • Do problems 10, 11, 13, 14, 15