Download
1 / 20
220 likes | 482 Views
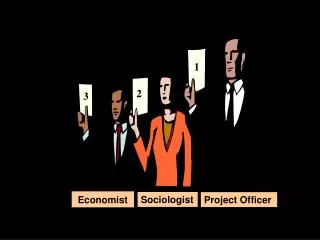
The Economist as Scientist. Economists play two roles: Scientists: try to explain the world Policy advisors: try to improve it In the first role, economists employ the scientific method : the dispassionate development and testing of theories about how the world works.

E N D
The Economist as Scientist • Economists play two roles: • Scientists: try to explain the world • Policy advisors: try to improve it • In the first role, economists employ the scientific method: the dispassionate development and testing of theories about how the world works.
Assumptions & Models • Assumptions simplify the complex world, make it easier to understand. • Example: When studying international trade, we might assume the world consists of two countries and two goods. Very unrealistic, but simplifies the problem and yields useful insights about the more complicated real world. • Economists use models to study economic issues. A model is a highly simplified representation of a more complicated reality.
PRODUCTION POSSIBILITIES • The boundary between the combinations of goods and services that can be produced and the combinations that cannot be produced, given the available factors of production and the state of technology. • A graph that shows the combinations of two goods the economy can possibly produce given the available resources and the available technology. • The PPF is a valuable tool for illustrating the effects of scarcity and its consequences.
PRODUCTION POSSIBILITIES Figure 3.1 shows the PPF for bottled water and CDs. Each point on the graph represents a column of the table. The line through the points is the PPF.
PRODUCTION POSSIBILITIES • The PPF puts two features of production possibilities in sharp focus: • Attainable and unattainable combinations • Efficient and inefficient production
PRODUCTION POSSIBILITIES We can produce at any point inside the PPF or on the frontier. Points outside the PPF such as point G are unattainable. The PPF separates attainable combinations from unattainable combinations.
PRODUCTION POSSIBILITIES • Efficient and Inefficient Production • Production efficiency • A situation in which we cannot produce more of one good or service without producing less of something else. • Figure 3.3 on the next slide illustrates the distinction between efficient and inefficient production.
OPPORTUNITY COST • The Opportunity Cost of a Bottle of Water • The opportunity cost of a bottle of water is the decrease in the quantity of CDs divided by the increase in the number of bottles of water as we move along the PPF.
OPPORTUNITY COST Moving from A to B, 1 bottle of water costs 1 CD.
OPPORTUNITY COST Moving from B to C, 1 bottle of water costs 2 CDs.
OPPORTUNITY COST Moving from C to D, 1 bottle of water costs 3 CDs.
OPPORTUNITY COST Moving from D to E, 1 bottle of water costs 4 CDs.
3.2 OPPORTUNITY COST Moving from E to F, 1 bottle of water costs 5 CDs.
OPPORTUNITY COST • Increasing Opportunity Cost • The opportunity cost of a bottle of water increases as more CD’S are produced.
Milk Mountain Bikes Why the PPF Might Be Bow-Shaped As the economy shifts resources from milk to mountain bikes: • PPF becomes steeper • opp. cost of mountain bikes increases
Why the PPF Might Be Bow-Shaped At A, opp. cost of mtn bikes is low. A At point A, most workers are producing milk, even those that are better suited to buildingmountain bikes. So, you do not have to give up much milk to get more bikes. Milk Mountain Bikes
Why the PPF Might Be Bow-Shaped At B, opp. cost of mtn bikes is high. At B, most workers are producing bikes. The few left in milk are the best milkers. Producing more bikes would require shifting some of the best milkers away from milk production, which would cause a big drop in milk output. Milk B Mountain Bikes
slope = The PPF and Opportunity Cost The slope of a line equals the “rise over the run” – the amount the line rises when you move to the right by one unit. –1000 = –10 100 Here, the opportunity cost of a computer is 10 tons of wheat.
The PPF and Opportunity Cost • Recall: The opportunity cost of an item is what must be given up to obtain that item. • Moving along a PPF involves shifting resources (e.g., labor) from the production of one good to the other. • Society faces a tradeoff: Getting more of one good requires sacrificing some of the other. • The slope of the PPF tells you the opportunity cost of one good in terms of the other.
The PPF: A Summary • The PPF shows all combinations of two goods that an economy can possibly produce, given its resources and technology. • The PPF illustrates the concepts of tradeoff and opportunity cost, efficiency and inefficiency, unemployment, and economic growth. • A bow-shaped PPF illustrates the concept of increasing opportunity cost.