Download
1 / 22
220 likes | 302 Views
2014 Research Areas and Projects. Data Mining and Machine Learning Group Its research is focusing on: Spatial Data Mining Clustering Classification and Prediction GIS 2. Current and Planned Projects Learning Supervised Taxonomies for Bioinformatics

E N D
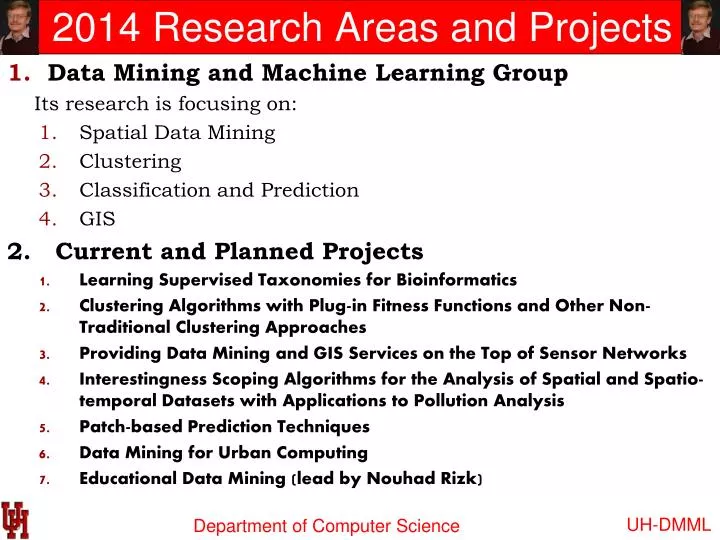
2014 Research Areas and Projects • Data Mining and Machine Learning Group Its research is focusing on: • Spatial Data Mining • Clustering • Classification and Prediction • GIS 2. Current and Planned Projects • Learning Supervised Taxonomies for Bioinformatics • Clustering Algorithms with Plug-in Fitness Functions and Other Non-Traditional Clustering Approaches • Providing Data Mining and GIS Services on the Top of Sensor Networks • Interestingness Scoping Algorithms for the Analysis of Spatial and Spatio-temporal Datasets with Applications to Pollution Analysis • Patch-based Prediction Techniques • Data Mining for Urban Computing • Educational Data Mining (lead by NouhadRizk) UH-DMML
M 1. Polygenetic Tree Induction Metagenomics http://en.wikipedia.org/wiki/Metagenomics
Input To Supervised Taxonomy Learning Example Dataset: gene sequences (of Bacteria) Similarity Matrix: determines/constrains which set of sequences can be merged. UH-DMML Group 9
Examples polygenetic tree that incorporates background knowledge Oligotrophic Psychrophilic 10 8 9 7 Radiation 3 6 10 7 5 6 10 10 9 9 9 4 8 5 8 7 4 6 3 8 Possible result obtained by maximizing purity while maintaining contiguous clusters. Possible result obtained by ignoring background knowledge UH-DMML Group 11
Submitted NASA Proposal Ch. Eick
2. Spatial and Spatio-Temporal Clustering Algorithms • Representative-based: SCEC, CLEVER • Grid-based: SCMRG,… • Agglomerative: MOSAIC • Density-based: DCONTOUR (not really plug-in but some fitness functions can be simulated) Density-based Grid-based Representative-based Agglomerative-based Clustering Algorithms Remark: All algorithms partition a dataset into clusters by maximizing a reward-based, plug-in fitness function.
Non-Traditional Clustering Algorithms Clustering Algorithms With plug-in Fitness Functions Creating Polygon Models For Spatial Clusters Mining Spatio-Temporal Datasets Agglomerative Clustering and Hotspot Discovery Algorithms Prototype-based Clustering Parallel Computing Randomized Hill Climbing With a Lot of Cores UH-DMML
3. Data Mining/GIS on Top of Sensor Networks Christoph F. Eick
4. Interestingness Hotspot Discovery Framework for Grids • Objective: Find hotspots in grid-based datasets using plugin interestingness and reward functions. • Methodology: • Find hotspots in grid-based spatio-temporal datasets using hotspot discovery algorithms and clustering techniques. Employ plugin interestingness and reward functions to evaluate quality of hotspots. • Generate cluster summaries • Visualize 4-dimensional spatio-temporal clusters and cluster summaries • Dataset: We are working on a 4-dimensional grid-based air pollution dataset. • Each grid cell overs a 4x4 km area. There are 150,000 4D grid cells. • Grid cells have latitude, longitude, layer (altitude), and time dimensions. • Each grid cell is associated with hourly observations of 132 compounds on air. Low variation hotspots UH-DMML
Interestingness Hotspot Discovery Framework for Grids • Problem: Find 4D contiguous regions maximizing a plugin reward function: • Reward(R) = interestingness(R) x size(R)bwhere • Interestingness(R) = Where 0 < th < 1 is the reward threshold, is the correlation of the 2 variables in the region R. • Currently we are using Ozone and PM2.5 levels as variables. Ozone PM2.5 <-Highly Correlated region-> PM2.5 concentration in the region Ozone concentration in the region UH-DMML
Interestingness Hotspot Discovery Framework for Grids • Hotspot Discovery Algorithm: • Phase 1: Pre-process the dataset and find n small regions with high interestingness (correlation) called seed hotspots (Seeding Phase) • Phase 2: For each of these regions, grow them as long as there is an improvement in the reward of the region (Growing Phase). • Keep a list of objects in the region and another list for neighbors of the region. • Among the neighboring objects, find the one which, when added, increases the reward function most and add it into the region. • Then add the neighbors of the newly added cube into the neighbors list of the region (if not in the list already) and remove the newly added cube from the neighbors list. • Phase 3: Remove hotspots with high overlap and/or low rewards from the set of hotspots computed in Phase 2 (Post-processing Phase) • Agglomerative Clustering Algorithm for Grid-structured Datasets: • Divide the grid data into many smaller regions of same size. • Keep a list of merge candidates. For each region, neighboring regions are merge candidates. • WHILE there are merge candidates left • BEGIN • Merge the pair of merge candidates that enhances the reward function most into a new region R’ • Update merge candidates after merge operation incrementally • END • RETURN the best clustering found UH-DMML
5. Patch-based Prediction Techniques • New Algorithms for Regression Tree Induction • New Decision Tree Induction Algorithms • Multi-Target Regression • Spatial Prediction Techniques Ch. Eick
6. Urban Computing—Mining POI Datasets Motivation: • A lot of POI datasets (e.g. in Google Earth) are becoming available now. • http://bloomington.in.gov/documents/viewDocument.php?document_id=2455;dir=building/buildingfootprints/shape • https://data.cityofchicago.org/Buildings/Building-Footprints/w2v3-isjw Buildings of the City of Chicago (830,000 Polygons) : Challenges: • Extract Valuable Knowledge from such datasets Data Mining • Facilitate Querying and Visualizing of such dataset HPC / BigData Initiative
Y. Helping Scientists to Make Sense Out of their Data Figure 1: Co-location regions involving deep and shallow ice on Mars Figure 2: Interestingness hotspots where both income and CTR are high. Figure 3: Mining hurricane trajectories Ch. Eick
Some UH-DMML Graduates 1 Tae-wan Ryu, Professor, Department of Computer Science, California State University, Fullerton Dr. Wei Ding, Assistant Professor Department of Computer Science, University of Massachusetts, Boston Sharon M. Tuttle, Professor, Department of Computer Science, Humboldt State University, Arcata, California Christoph F. Eick
Some UH-DMML Graduates 2 Ruth Miller Ruth Miller, PhD Washington Unversityin St. Louis, Postdoc - Midwest Alcohol Research Center, Department of Psychiatry. Adjunct Instructor - Department of Computer Science Chun-sheng Chen, PhD, Amazon RachsudaJiamthapthaksin PhD Lecturer Assumption University, Bangkok, Thailand Justin Thomas MS Section Supervisor at Johns Hopkins University Applied Physics Laboratory Mei-kang Wu MSMicrosoft, Bellevue, Washington Jing Wang MS AOL, California Christoph F. Eick
UH-DMML Mission Statement The Data Mining and Machine Learning Group at the University of Houston aims at the development of data analysis, data mining, and machine-learning techniques and to apply those techniques to challenging problems in geology, urban computing, ecology, environmental sciences, web advertising and bioinformatics. In general, our research group has a strong background in the areas of clustering and spatial data mining and partially GIS. Areas of our current research include: clustering algorithms with plug-in fitness functions, association analysis, mining related spatial data sets, patch-based prediction techniques, summarizing the composition of spatial datasets, learning taxonomies for bioinformatics, data mining and GIS services on the top of sensor networks. and data mining with a lot of cores. Website: http://www2.cs.uh.edu/~UH-DMML/index.html Research Group Publications: http://www2.cs.uh.edu/~ceick/pub.html Data Mining Course Website: http://www2.cs.uh.edu/~ceick/DM/DM.html Machine Learning Course Website: http://www2.cs.uh.edu/~ceick/ML/ML.html Ch. Eick
What Courses Should You Take to Conduct Research in this Research Group? Data Mining Machine Learning, GIS Parallel Programming, AI, Software Design, Data Structures, Databases, Visualization, Evolutionary Computing, Image Processing, Geometry, Optimization, Bioinformatics. UH-DMML
Finding Regional Co-location Patterns in Spatial Datasets Figure 1: Co-location regions involving deep and shallow ice on Mars Figure 2: Chemical Co-location patterns in Texas Water Supply Objective: Find co-location regions using various clustering algorithms and novel fitness functions. Applications: 1. Finding regions on planet Mars where shallow and deep ice are co-located, using point and raster datasets. In figure 1, regions in red have very high co-location and regions in blue have anti co-location. 2. Finding co-location patterns involving chemical concentrations with values on the wings of their statistical distribution in Texas’ ground water supply. Figure 2 indicates discovered regions and their associated chemical patterns. UH-DMML
REG^2: a Regional Regression Framework • Motivation: Regression functions spatially vary, as they are not constant over space • Goal:To discover regions with strong relationships between dependent & independent variables and extract their regional regression functions. Discovered Regions and Regression Functions REG^2 Outperforms Other Models in SSE_TR • Clustering algorithms with plug-in fitness functions are employed to find such region; the employed fitness functions reward regions with a low generalization error. • Various schemes are explored to estimate the generalization error: example weighting, regularization, penalizing model complexity and using validation sets,… Regularization Improves Prediction Accuracy UH-DMML
Mining Spatial Trajectories • Goal: Understand and Characterize Motion Patterns • Themes investigated: Clustering and summarization of trajectories, classification based on trajectories, likelihood assessment of trajectories, prediction of trajectories. Arctic Tern Arctic Tern Migration Hurricanes in the Golf of Mexico UH-DMML