Download
1 / 18
180 likes | 256 Views
Estimating the Value of Data from Non-Governmental Agencies and Citizens to the AIRNow Program. Timothy S. Dye 1 , Patrick H. Zahn 1 , Daniel M. Alrick 1 , John E. White 2 , John Birks 3 , and Jessa Ellenburg 4 1 Sonoma Technology, Inc. 2 U.S. Environmental Protection Agency

E N D
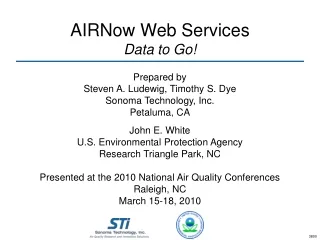
Estimating the Value of Data from Non-Governmental Agencies and Citizens to the AIRNow Program Timothy S. Dye1, Patrick H. Zahn1, Daniel M. Alrick1, John E. White2, John Birks3, and Jessa Ellenburg4 1Sonoma Technology, Inc. 2U.S. Environmental Protection Agency 32B Technologies, Inc. 4GO3 Project Presented at the National Air Quality Conferences March 7-10, 2011 San Diego, CA 4068
Outline • Background • Pilot project with GO3 Project • Instrument details • Data comparisons • Data merging and fusion • Results • Challenges and benefits for AIRNow
Background – Monitoring by Citizens • Citizen science • Measurements made by • Citizens • Non-government organizations • Data collected • At fixed locations or moving platforms • Indoors and/or outdoors • Technology is key • Monitor cost and size • Internet telemetry and reporting
Background – Measurement Approaches • Miniaturize AQ instruments • BAM EBAM • 2BTech ozone instrument • Use low-cost, less accurate sensors • University efforts • Intel Berkeley • Do It Yourself (DIY) community 2B Technologies, Inc. Stacey Kuznetsov Carnegie Mellon University Allison Woodruff Intel
Background – AIRNow • Data coverage • Increased coverage is costly • Many data gaps still exist • New mapping systems • Better methods • NASA project data fusion AIRNow ozone monitoring network coverage
Pilot Project with GO3 • The Global Ozone (GO3) Project • Middle and HS students get monitors • Strong focus on education • Student-run ozone monitoring stations • Locations in • U.S. (mostly Colorado) (40) • International (32) GO3 Project GO3 Project
Pilot Project with GO3 20 Sites (CO Dept. of Public Health and Environment) 31 Sites (GO3 Project, by June 2011)
Pilot Project – Data Quality Location: Rifle, Colorado Monitors: AIRNow and GO3 (within 0.5 mi) Period: February through August 2010 GO3 ozone concentration (ppb)
70% 90% 100% 85% Pilot Project – Mapping • Data • 1-hr ozone data • Focus on Colorado • Methods to test • Merged • Fused-Weighed Data Data Data QC Weighted Grids Fused Grid Data QC Merged Grid
Pilot Program – Mapping AIRNow and GO3 monitors in Colorado Wyoming Wyoming Colorado Colorado New Mexico New Mexico Locations of AIRNow Sites Locations of GO3 Sites
Pilot Program – Mapping Merged 1-hour maximum daily ozone concentrations, 07/15/2010 Concentration (ppb) AIRNow-Tech Sites Only AIRNow-Tech and GO3 Sites Mean interpolation error: 0.5132 ppb RMS interpolation error: 7.836 ppb Mean interpolation error: 0.2214 ppb RMS interpolation error: 7.108 ppb RMS = Root-Mean-Square
Pilot Program – Mapping Merged Prediction Standard Error (PSE) Measure uncertainty of AQI estimations in regions without monitors PSE was also reduced across the domain GO3 data reduced PSE, especially near the added monitors Large error (PSE ≥ 13 ppb) reduced by roughly 18,000 km2 Without GO3 sites Mean PSE = 14.3 ppb Including GO3 sites (shown in pink) Mean PSE = 13.8 ppb The 13-14 ppb PSE contour has been highlighted (in blue) to illustrate a larger area with low PSE resulting from the inclusion of GO3 data (right).
Pilot Program – Fused-Weighted Concentration (ppb) 1-hour maximum daily ozone concentrations, 07/15/2010 AIRNow-Tech Sites Only AIRNow-Tech and GO3 Sites Bias: -0.12 ppb Mean Absolute Error: 0.45 ppb Bias: 0.0 ppb* Mean Absolute Error: 0.02 ppb* *Compares interpolated value to monitor data point
Pilot Program – What’s Next • Deliver routine GO3 data for 31 sites to AIRNow • Test data fusion as part of NASA project (satellite, model, observations) • Post on AIRNow-Tech • Evaluate improvement/effect on AIRNow • Present results to AIRNow stakeholders and steering committee
Challenges and Benefits for AIRNow • Data issues • Quality • Reliability • Ownership • Representativeness • “Gap filling” in data-sparse areas • Citizen engagement and involvement
Contact Tim Dye Sonoma Technology, Inc. Tim@SonomaTech.com (707) 665-9900