Download

1 / 30
310 likes | 415 Views
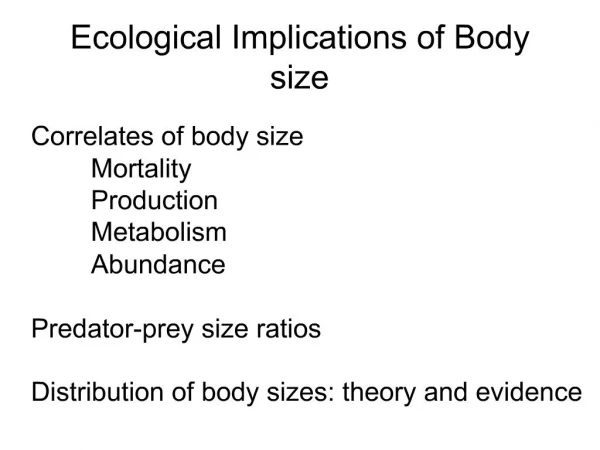
Lecture 9 Moments of distributions. Body size distribution of European Collembola. Body size distribution of European Collembola. Modus. The histogram of raw data. Three Collembolan weight classes. What is the average body weight ? . Sample mean. Population mean.

E N D
Lecture 9 Moments of distributions Body sizedistribution of EuropeanCollembola
Body sizedistribution of EuropeanCollembola Modus The histogram of raw data
ThreeCollembolanweightclasses Whatistheaverage body weight? Sample mean Population mean Weighedmean
Weighed mean Discrete distributions TheaverageEuropeanspringtailhas a body weight of e-1.476 = 023 mg. Most oftenencountedis a weightaround e-1.23 = 029 mg. Continuous distributions
Whydid we use log transformedvalues? Linear data Log transformed data Thedistributionisskewed
lbscaledweightclasses TheaverageEuropeanspringtailhas a body weight of e-1.476 = 023 mg. Geometricmean In thecase of exponentiallydistributed data we have to usethegeometricmean. To make thingseasier we first log-transformour data.
Degrees of freedom Variance Continuousdistributions Mean 1 SD Standard deviation The standard deviationis a measure of thewidth of thestatisticaldistributionthathasthe sam dimension as themean.
The standard deviation as a measure of errors ± 1 standard deviationisthe most oftenusedestimator of error. Theprobablitythatthetruemeaniswithin± 1 standard deviationisapproximately 68%. Theprobablitythatthetruemeaniswithin± 2 standard deviationsisapproximately 95%. The precision of derivedmetricsshouldalwaysmatchthe precision of theraw data ± 1 standard deviation
Standard deviation and standard error The standard deviationisconstantirrespective of samplesize. The precision of theestimate of themeanshouldincreasewithsamplesize n. The standard erroris a measure of precision.
Central moments [E(x)]2 E(x2) Mathematicalexpectation First central moment First moment of central tendency Thevarianceisthedifferencebetweenthemean of thesquaredvalues and thesquaredmean k-th central moment
Third central moment Skewness g>0 g<0 g=0 Leftskeweddistribution Rightskeweddistribution Symmetricdistribution d>0 d=0 Kurtosis
Lecture10 Importantstatisticaldistributions Whatistheprobabilitythat of 10 newbornbabiesatleast7 areboys? p(girl) = p(boy) = 0.5 Bernoulli distribution
Bernoulli orbinomialdistribution The Bernoulli orbinomialdistributioncomesfromthe Taylor expansion of thebinomial
Assume the probability to find a certain disease in a tree population is 0.01. A bio-monitoring program surveys 10 stands of trees and takes in each case a random sample of 100 trees. How large is the probability that in these stands 1, 2, 3, and more than 3 cases of this disease will occur? Mean, variance, standard deviation
What happens if the number of trials n becomes larger and larger and p the event probability becomes smaller and smaller. Poisson distribution Thedistributionorrareevents
Assume the probability to find a certain disease in a tree population is 0.01. A bio-monitoring program surveys 10 stands of trees and takes in each case a random sample of 100 trees. How large is the probability that in these stands 1, 2, 3, and more than 3 cases of this disease will occur? Bernoulli solution Poisson solution Theprobabilitythat no infectedtree will be detected Bernoulli solution Theprobability of morethanthreeinfectedtrees
Variance, mean Skewness
Whatistheprobabilityin Duży Lotek to havethreetimescumulationifthe first time 14 000 000people bet, thesecond time 20 000 000, and the third time 30 000 000? Theprobability to win is The zero term of the Poisson distributiongivestheprobability of no event Theprobability of atleast one event: Theeventsare independent:
A pile model to generatethebinomial. Ifthenumber of stepsisvery, verylargethebinomialbecomessmooth. Abraham de Moivre (1667-1754) Thenormaldistributionisthecontinousequivalent to thediscrete Bernoulli distribution
The central limit theorem If we have a series of random variatesXn, a new random variateYn that is the sum of all Xn will for n→∞ be a variate that is asymptotically normally distributed.
ThenormalorGaussiandistribution Mean: m Variance: s2
Important features of the normal distribution • The function is defined for every real x. • The frequency at x = m is given by • The distribution is symmetrical around m. • The points of inflection are given by the second derivative. Setting this to zero gives
0.68 +s -s 0.95 +2s -2s Many statisticaltestscompareobservedvalueswiththose of the standard normaldistribution and assigntherespectiveprobabilities to H1.
TheZ-transform Thevariate Z has a mean of 0 and andvariance of 1. The standard normal A Z-transformnormalizeseverystatisticaldistribution. Tables of statisticaldistributionsarealwaysgiven as Z-transforms. The 95% confidence limit
TheZ-transformed (standardized) normaldistribution 0.68 +s -s 0.95 +2s -2s P(m - s < X < m + s) = 68% P(m - 1.65s < X < m + 1.65s) = 90% P(m - 1.96s < X < m + 1.96s) = 95% P(m - 2.58s < X < m + 2.58s) = 99% P(m - 3.29s < X < m + 3.29s) = 99.9% TheFisheriansignificancelevels
Theestimation of thepopulationmeanfrom a series of samples x,s x,s x,s x,s x,s x,s x,s x,s The n samplesfrom an additive random variate. Z isasymptoticallynormallydistributed. m,s Standard error Confidence limit of theestimate of a meanfrom a series of samples. aisthedesiredprobabilitylevel.
How to apply the normal distribution Intelligence is approximately normally distributed with a mean of 100 (by definition) and a standard deviation of 16 (in North America). For an intelligence study we need 100 persons with an IO above 130. How many personsdo we have to test to find this number if we take random samples (and do not test university students only)?
One and two sided tests We measure blood sugar concentrations and know that our method estimates the concentration with an error of about 3%. What is the probability that our measurement deviates from the real value by more than 5%?
Albinos are rare in human populations. Assume their frequency is 1 per 100000 persons. What is the probability to find 15 albinos among1000000 persons? =KOMBINACJE(1000000,15)*0.00001^15*(1-0.00001)^999985 = 0.0347