Download
1 / 20
200 likes | 332 Views
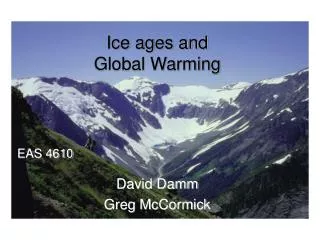
Global Warming: A Challenge for Green Trade. Andrew J. Weaver School of Earth & Ocean Sciences University of Victoria. Taipei, Taiwan June 13, 2012. 1962 Life Magazine Advertisement. Globally-Averaged Surface Temperature since 1880.

E N D
Global Warming: A Challenge forGreen Trade Andrew J. Weaver School of Earth & Ocean Sciences University of Victoria Taipei, Taiwan June 13, 2012
Globally-Averaged Surface Temperature since 1880 Surface temperature anomaly relative to the 1901-2000 average
The Top 10 Warmest Years since 1880 Surface temperature anomaly relative to the 1901-2000 average 11th Upper ocean heat content from 1955-2005 relative to the 1961-1990 average
Solar forcing & the global mean surface temperature record Lockwood, M., and C. Fröhlich, 2007: Recent oppositely directed trends in solar climate forcings and the global mean surface air temperature. Proceedings of the Royal Society, Series A, 463, 2447–2460. Mike Lockwood Claus Fröhlich “…over the past 20 years, all the trends in the Sun that could have had an influence on the Earth’s climate have been in the opposite direction to that required to explain the observed rise in global mean temperatures.”
Arctic Minimum September Sea Ice Extent September 16, 2007
Average from many models (relative to years 1980–1999) Annual mean projections of future climate 1.8°C globally warmer 0.2°C/decade warming independent of emissions trajectory 4.0°C globally warmer Intergenerational Equity
Summer surface temperature anomalies relative to 1951-1980 mean in units of the local detrended 1981-2010 standard deviation Percent >1 standard deviation (σ): 31.7%; Percent >2σ: 4.6%; Percent >3σ: 0.27%; Percent >4σ: 0.006%; Percent >5σ: 0.000057% Hansen, Sato, Rueby (2012) Public perception of climate change and the new climate dice. Proceedings of the National Academy of Sciences, submitted.
Precipitation 2080–2099 average of many models relative to 1980–1999
Smith, JB, SH Schneider, M Oppenheimer et al., 2009: Assessing dangerous climate change through an update of the IPCC "reasons for concern". Proceedings of the National Academy of Sciences, doi: 10.1073/pnas.0812355106 2°C Guardrail
Response of natural ecosystems Working Group II of the IPCC 50% of all nature reserves will no longer fulfill their conservation mandate Reasons for Concern 3 °C further warming 9%–31% of the world’s species become committed to extinction 0.9 °C further warming 15%–37% of the world’s species become committed to extinction 1.5 °C further warming 21%-52% of the world’s species become committed to extinction 2.2 °C further warming 40%-70% of the world’s species become committed to extinction 3.3 °C further warming
Global security and political instability Impacts are distributed disproportionately to subtropical and hence developing world 80% of cumulative past emissions come from the developed world But Reasons for Concern Developed nations have technological and economic ability to assist in adaptation Developing nations have neither technological nor economic ability to adapt But Environmental Refugees!
USA & Canada on the International Scene (2008 data) Per capita carbon emissions in metric tonnes Total carbon emissions in millions in metric tonnes #57 Iceland 1.93 Canada / 2.3 #76 Sweden 1.45! Canada / 3.1 #205 Ethiopia 0.02! Canada /223
Global population growth 80% of total anthropogenic CO2 emissions from more developed nations 80% of the problem from 20% of the people
Cumulative emissions of CO2 from 1900-2005 (millions of tons of CO2)
Anthropogenic Carbon Dioxide Sources 1) Combustion of Fossil Fuels: Fossil Fuel + Oxygen = Carbon Dioxide + Water Vapour + Heat 2) Cement Production Limestone (CaCO3) + Clay or SiO2 heated to produce “clinker” CO2 3) Deforestation 2010: Combustion of fossil fuels: 8.7 Gigatonnes of carbon (109 kg C) Cement production: 0.4Gigatonnes of carbon (109 kg C) Land Use Change: 0.9 Gigatonnes of carbon (109 kg C) Cumulative emissions from 1850 to 2010: Fossil fuel combustion + Cement Productions: 365Gigatonnes of carbon (109 kg C) Deforestation & land use emissions: 162Gigatonnes of carbon (109 kg C) Today deforestation has contributed 1/3 of the problem Tomorrow reforestation can contribute 1/3 of the solution