Download
1 / 1
10 likes | 105 Views
Remotely sensed browning trends in boreal Alaska: A data artifact? Mary Beth Parent, University of Alaska, Fairbanks Advisor: Dave Verbyla, University of Alaska, Fairbanks Committee: Patricia Heiser & Glenn Juday, University of Alaska, Fairbanks. Project Summary. Methods. Results.

E N D
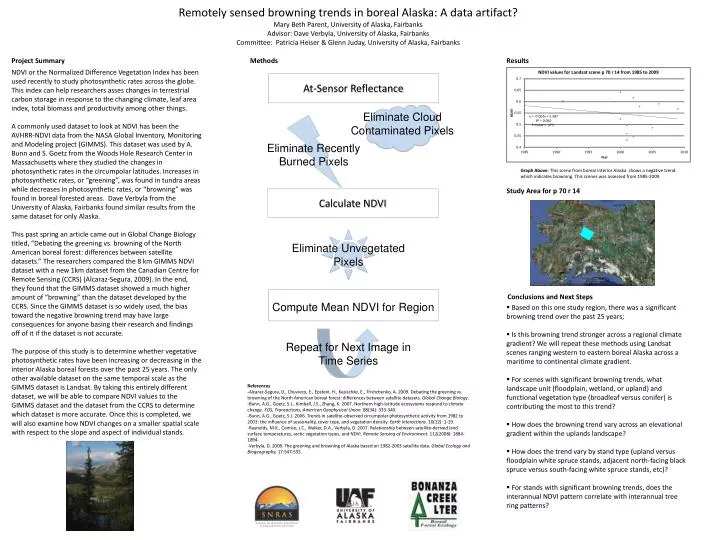
Remotely sensed browning trends in boreal Alaska: A data artifact? Mary Beth Parent, University of Alaska, Fairbanks Advisor: Dave Verbyla, University of Alaska, Fairbanks Committee: Patricia Heiser & Glenn Juday, University of Alaska, Fairbanks Project Summary Methods Results NDVI or the Normalized Difference Vegetation Index has been used recently to study photosynthetic rates across the globe. This index can help researchers asses changes in terrestrial carbon storage in response to the changing climate, leaf area index, total biomass and productivity among other things. A commonly used dataset to look at NDVI has been the AVHRR-NDVI data from the NASA Global Inventory, Monitoring and Modeling project (GIMMS). This dataset was used by A. Bunn and S. Goetz from the Woods Hole Research Center in Massachusetts where they studied the changes in photosynthetic rates in the circumpolar latitudes. Increases in photosynthetic rates, or “greening”, was found in tundra areas while decreases in photosynthetic rates, or “browning” was found in boreal forested areas. Dave Verbyla from the University of Alaska, Fairbanks found similar results from the same dataset for only Alaska. This past spring an article came out in Global Change Biology titled, “Debating the greening vs. browning of the North American boreal forest: differences between satellite datasets.” The researchers compared the 8 km GIMMS NDVI dataset with a new 1km dataset from the Canadian Centre for Remote Sensing (CCRS) (Alcaraz-Segura, 2009). In the end, they found that the GIMMS dataset showed a much higher amount of “browning” than the dataset developed by the CCRS. Since the GIMMS dataset is so widely used, the bias toward the negative browning trend may have large consequences for anyone basing their research and findings off of it if the dataset is not accurate. The purpose of this study is to determine whether vegetative photosynthetic rates have been increasing or decreasing in the interior Alaska boreal forests over the past 25 years. The only other available dataset on the same temporal scale as the GIMMS dataset is Landsat. By taking this entirely different dataset, we will be able to compare NDVI values to the GIMMS dataset and the dataset from the CCRS to determine which dataset is more accurate. Once this is completed, we will also examine how NDVI changes on a smaller spatial scale with respect to the slope and aspect of individual stands. At-Sensor Reflectance Eliminate Cloud Contaminated Pixels Eliminate Recently Burned Pixels Graph Above: This scene from boreal interior Alaska shows a negative trend which indicates browning. This scenes was assessed from 1985-2009. Study Area for p 70 r 14 Calculate NDVI Eliminate Unvegetated Pixels Conclusions and Next Steps Compute Mean NDVI for Region • Based on this one study region, there was a significant browning trend over the past 25 years; • Is this browning trend stronger across a regional climate gradient? We will repeat these methods using Landsat scenes ranging western to eastern boreal Alaska across a maritime to continental climate gradient. • For scenes with significant browning trends, what landscape unit (floodplain, wetland, or upland) and functional vegetation type (broadleaf versus conifer) is contributing the most to this trend? • How does the browning trend vary across an elevational gradient within the uplands landscape? • How does the trend vary by stand type (upland versus floodplain white spruce stands, adjacent north-facing black spruce versus south-facing white spruce stands, etc)? • For stands with significant browning trends, does the interannual NDVI pattern correlate with interannual tree ring patterns? Repeat for Next Image in Time Series References -Alcaraz-Segura, D., Chuvieco, E., Epstein, H., Kasischke, E., Trishchenko, A. 2009. Debating the greening vs. browning of the North American boreal forest: differences between satellite datasets. Global Change Biology. -Bunn, A.G., Goetz, S.J., Kimball, J.S., Zhang, K. 2007. Northern high-latitude ecosystems respond to climate change. EOS, Transactions, American Geophysical Union. 88(34): 333-340. -Bunn, A.G., Goetz, S.J. 2006. Trends in satellite-observed circumpolar photosynthetic activity from 1982 to 2003: the influence of seasonality, cover type, and vegetation density. Earth Interactions. 10(12): 1-19. -Raynolds, M.K., Comiso, J.C., Walker, D.A., Verbyla, D. 2007. Relationship between satellite-derived land surface temperatures, arctic vegetation types, and NDVI. Remote Sensing of Environment. 112(2008): 1884-1894. -Verbyla, D. 2008. The greening and browning of Alaska based on 1982-2003 satellite data. Global Ecology and Biogeography. 17:547-555.