Download
1 / 24
240 likes | 400 Views
The Wisconsin Buffer Initiative: Citizens and Scientists Finding Interdisciplinary Solutions to Environmental Problems. The Charge to the University of Wisconsin from the Wisconsin Natural Resources Board.

E N D
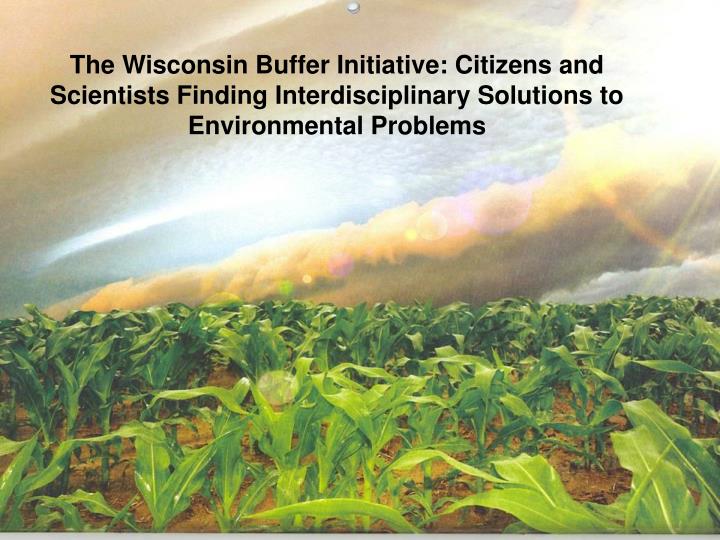
The Wisconsin Buffer Initiative: Citizens and Scientists Finding Interdisciplinary Solutions to Environmental Problems
The Charge to the University of Wisconsinfrom the Wisconsin Natural Resources Board Based on “the best and most complete available science” where are riparian buffers most needed across the diverse Wisconsin landscape in order to enhance or protect water quality in the most effective and efficient manner?
The Wisconsin Buffer Initiative NGOs UW Scientists AgriculturalInterests FederalAgencies TNC River Alliance Trout Unlimited WLWCA WALCE EnvironmentalDefense WASI DNR StateAgencies DevelopScience ofBuffersfor AdaptiveManagementProgram DATCP PDPW USDA-FSA FarmBureau USGS CornGrowers USDA-NRCS
What was Accomplished • The WBI reached consensus that three main criteria should be used to address agricultural nonpoint source pollution in Wisconsin.1. Reducing sediment and nutrient loads.2. Protecting native aquatic species sensitive to sediments.3. Preventing eutrophication in the lakes and other impoundments into which the rivers and streams of Wisconsin flow.
What was Accomplished • Reached agreement that smaller watersheds were the mechanism by which WBI recommendations should be implemented.1. It is easier to know when an implementation program is working in a smaller watershed.2. Local landowners are more likely to take ownership of their watershed when it is smaller.3. Scarce fiscal and personnel resources can be targeted better in smaller watersheds.
What was Accomplished • Agreed that priority should be given to those situations where there is a high probability of a positive response due to implementing WBI recommendations.1. Enhance rather than being redundant with existing state and federal programs.2. Focus efforts in those situations where the effort will make a difference to the three criteria.
What was Accomplished • Divided Wisconsin into 1598 hydrologically complete watersheds. • Used existing data and models to provide a score for each watershed on each of the three criteria. • Generated a ranked list of 1598 watersheds based on probability of response to WBI recommendations.
Nutrient/Sediment Index Stream Habitat Trophic Index Combining Responsiveness Scores Composite ranking based on high rank in 1 or more single scores nutrient/sediment score stream biota score lake responsive score Final numeric rank on statewide basis: 1 - 1598
What was Accomplished • Developed tools and decision aids that could be used by local staff in high-ranked watersheds.1. Recognition that a small proportion of the landscape in any watershed has a high probability of making disproportionate contributions to water quality degradation. 2. Generate methods to use existing data to identify these locations, and then assist local staff in assessing land use practices at these locations.
Determine Areas with High Vulnerability GIS-based USLE analysis 30-Meter DEM Red = Area of focus Land Use SSURGO Soils USGS Runoff White = hill top Dark = valley bottom
Areas of highbiophysicalvulnerability Focus Local Staff Resources GIS-based USLE analysis (3-D Visualization) Relief Exaggerated
What was Accomplished Decided to use existing programs and standards to the extent possible to implement WBI recommendations.1. Recognition that it must be a systems approach including the upland areas above the riparian area. 2. Modified a nutrient planning decision aid (SNAP-Plus) to be used in determining if a riparian buffer is needed. 3. Created a Wisconsin Phosphorus Index (PI) to be used in determining if a riparian buffer is needed. Estimate risk of P delivery to surface water (P Index)
13 42 29b Upper Pasture Lower Pasture Assessing Fields Based on Existing Standards Run SNAP-Plus for rotation to determine fields needing alternatives Fields 13 and 29b Need additional assessment
Assessing Fields Based on Existing Standards Determine if existing management canbe changed to meet goals Field 13 Rotation: Cs-Cs-O-A-A-A-A Tillage: Spring chisel plowing, disking Fertilizer: No commercial fertilizer Manure: Dairy manure hauled daily/often Rates: 20 T/a on 1st yr corn, 40-50 T/a on 2nd yr corn, 5 T/a on alfalfa after 1st cut Winter manure on fields going into 2nd yr. corn
What was Accomplished • Agreed that riparian buffers needs to be designed relative to contributing area.1. Used PALMS and Discovery Farm research to validate that buffers, as part of a larger conservation system, need to be designed relative to what is happening in the upland areas.2. Agreed that the NRCS technical standards needs to be revised to reflect these findings.
Placement and Configuration of Conservation System Including Buffer Situations where upland treatments are not sufficient to solve runoff problems Bare soil runoff is concentrated Grassed waterway runoffis more diffuse, but stillnot sufficient
Placement and Configuration of Buffers Simple “ribbon” buffers may not capture sediments Modify existing design criteria to incorporate contributing area into buffer design 100 ft ribbonbuffer 50 m3 Engineered buffers 400 m3 5 m > (m3) CA/contour length
Summary - What was Accomplished • Agreement by a diverse group of interests that the program focus should be on a relatively few small areas causing a majority of problems in a way that is meaningful to local staff and landowners. • The focus of the program should be on solving problems rather than creating standards used in managing programs. • The WBI approach could serve as a template for other contentious resource management issues, and is capable of developing “win-win” outcomes for all parties involved. • Recognition that we can never fully understand the complex processes of environmental degradation, then we need to implement programs in a way that we learn from the process.
The Next Step:Testing the WBI Recommendations ReferenceWatershed USGS Monitoring Stations TreatmentWatershed
Thank You Contact: Pete Nowak atpnowak@wisc.edu 608-265-3581 http://www.drs.wisc.edu/wbi/