Download
1 / 27
270 likes | 378 Views
Spending Power Analysis. Spending Power per head is less in rural areas than in urban areas … yet … It costs more to provide services in rural areas … and … Council Tax is much higher per head in rural areas than in urban areas … this is because …

E N D
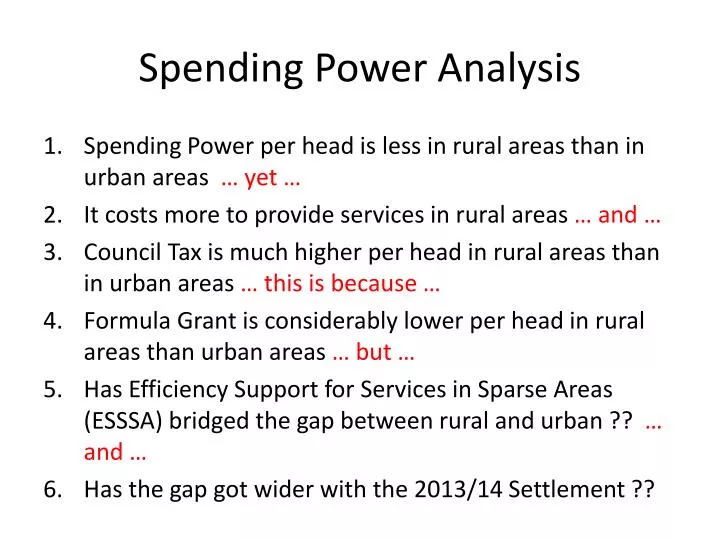
Spending Power Analysis • Spending Power per head is less in rural areas than in urban areas … yet … • It costs more to provide services in rural areas … and … • Council Tax is much higher per head in rural areas than in urban areas … this is because … • Formula Grant is considerably lower per head in rural areas than urban areas … but … • Has Efficiency Support for Services in Sparse Areas (ESSSA) bridged the gap between rural and urban ?? … and … • Has the gap got wider with the 2013/14 Settlement ??
‘We will take this opportunity to review the formulae for the cost of rural services’ Proving the Rural Penalty Additional Costs associated with providing refuse collection in West Devon
West Devon Borough CouncilRefuse Round Number 4 • Same driver and two loaders • Driving the same refuse truck • Five different rounds (Mon to Fri) • Wednesday round is predominantly Okehampton, a market town with a population of about 5,000 • Other four days are surrounding villages and hamlets
Both routes use the same vehicle and crew • Both routes take roughly the same time (full working day) Friday Wednesday
Friday • 473 properties • 79.14 square kms • 220 km Wednesday • Average 466m between properties • 1,499 properties • 8.16 square kms • 168 km • Average 112m between properties • Both routes use the same vehicle and crew • Both routes take roughly the same time (full working day)
West Devon Borough CouncilRefuse Collection Rural Penalty • Using multiple linear regression on 20 refuse rounds provides results which show: • That, on average, village properties in West Devon are 1.64 times more costly to collect than town properties (urban) • That, on average, properties in hamlets and isolated rural dwellings are 2.78 times more costly to collect than town properties (urban) • Waste management cost: West Devon 2011/12 is £1.66m
West Devon Borough CouncilRefuse Collection Rural Penalty • Using multiple linear regression on 20 refuse rounds provides results which show: • If all the properties in West Devon were urban and town/fringe and there were no village or hamlet/isolated properties to collect then the £1.66m cost would be £1.07m • This means that the rural penalty (ie the additional cost of collecting from villages and hamlets) equates to £590k
Camden Westminster Kensington & C Hammersmith & F
Spending Power per HeadAll Local Authorities (excluding fire authorities and GLA)
Spending Power per HeadCouncil Tax is shown in Red, Formula Grant in Blue
Council Tax is significantly higher per head in rural areas (by about £85)
Spending Power per HeadCouncil Tax is shown in Red, Formula Grant in Blue
Spending Power per HeadESSSA shown in purple ESSSA = 77p per head
Formula Grant is considerably lower per head in rural areas than urban areas (by about £135)
Spending Power Per HeadAll Local Authorities (excluding fire authorities and GLA)
Spending Power per HeadAll Local Authorities (excluding fire authorities and GLA)