Download
1 / 11
120 likes | 287 Views
Bayesian Factor Regression Models in the “Large p, Small n” Paradigm Mike West, Duke University. Presented by: John Paisley Duke University. Outline. Empirical Factor Regression (SVD) Latent Factor Regression Sparse Factor Regression. Linear Regression & Empirical Factor Regression.

E N D
Bayesian Factor Regression Models in the “Large p, Small n” ParadigmMike West, Duke University Presented by: John Paisley Duke University
Outline • Empirical Factor Regression (SVD) • Latent Factor Regression • Sparse Factor Regression
Linear Regression &Empirical Factor Regression • Linear Regression • SVD Regression D is a diagonal matrix of singular values
Empirical Factor Regression • By definition, • Regression is now done in factor space using generalized shrinkage (ridge regression) priors on , e.g. RVM • Problem of inversion: has many-to-one mapping • is canonical “least-norm” inverse
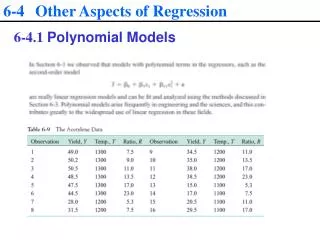
Example: Biscuit Dough Data • NIR spectroscopy reflectance values are predictors • Response is fat content of dough samples • 39 training, 39 testing: data are pooled and testing data responses treated as missing values to be imputed • Top 16 factors used, based on size of singular values
Example: Biscuit Dough Data (2) • Left: Fitted and predicted vs true values • Right: Least-norm inverse of beta • ~ 1700 nm range is absorbance region for fat • As can be seen, solution is not sparse
Latent Factor Regression • Loosen to • Under proper constraints on B, this finds common structure in X and isolates idiosyncrasies to noise • Now, variation in X has less effect on y • The implied prior is • When variance, Phi 0, this reverts to empirical linear regression
Sparse Latent Factor Regression • WRT gene expression profiling, “multiple biological factors underlie patterns of gene expression variation, so latent factor approaches are natural – we imagine that latent factors reflect individual biological functions… This is a motivating context for sparse models.” • Columns of B represents the genes involved in a particular biological factor. • Rows of B represent a particular gene’s involvement across biological factors.
Example: Gene Expression Data • p = 6128 genes measured using Affymetrix DNA microarrays • n = 49 breast cancer tumor samples • k = 25 factors • Factor 3 separates by red: estrogen receptor positive tumors blue: ER negative
Example: Gene Expression Data • Comparison with results obtained using empirical SVD factors
Conclusion • Sparse factor regression modeling is a promising framework for dimensionality reduction of predictors. • Only those factors that are relevant (e.g. factor 3) are of interest. Therefore, only those genes with non-zero values in that column of B are meaningful.