Download
1 / 10
100 likes | 101 Views
This presentation highlights the market analysis of Georgetown Hospital System's inpatient and observation trends in Georgetown, Horry, and Williamsburg counties. It includes data on market share, inpatient admissions via the emergency department, use rates per 1,000 people, and more. The analysis covers the years 2006 to 2012, excluding normal newborns.

E N D
Georgetown Hospital System Inpatient and Observation Market Analysis 2014 SCHA Leadership Summit 2014
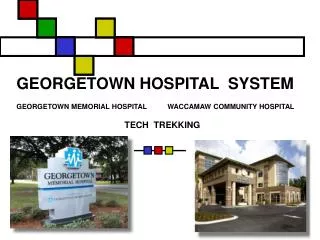
Georgetown Hospital System Inpatient and Observation Trends
Market AnalysisMarket Share for Georgetown, Horry and Williamsburg Counties—Summary by Facility Source: ORS Market Data. Note: Charleston is not included in this slide. Data excludes normal newborns (DRG 391 for 2006-2007 and MSDRG 795 for 2008-2012).
GHS MDC Category Including Mapped Observation Patients
GHS Inpatients and Observations By Age Category
GHS Inpatients and Observations By Surgical Attending
Market Analysis Use Rates per 1,000—Total Market by County Use rates per 1,000 for all counties within the four county market decreased between 2006 and 2012, with the exception of Williamsburg County. Georgetown County’s use rate continues to be significantly higher than other counties. Source: ORS Market Data. Note: Data excludes normal newborns (DRG 391 for 2006-2007 and MSDRG 795 for 2008-2012).