Download
1 / 38
380 likes | 458 Views
Better Practices for Shipboard Data Management. Cyndy Chandler Biological and Chemical Oceanography Data Management Office 12 November 2009 Ocean Acidification Short Course Woods Hole, MA USA. Discussion Topics. Research Cruise Allocation of sample (wire) time Allocation of sample water

E N D
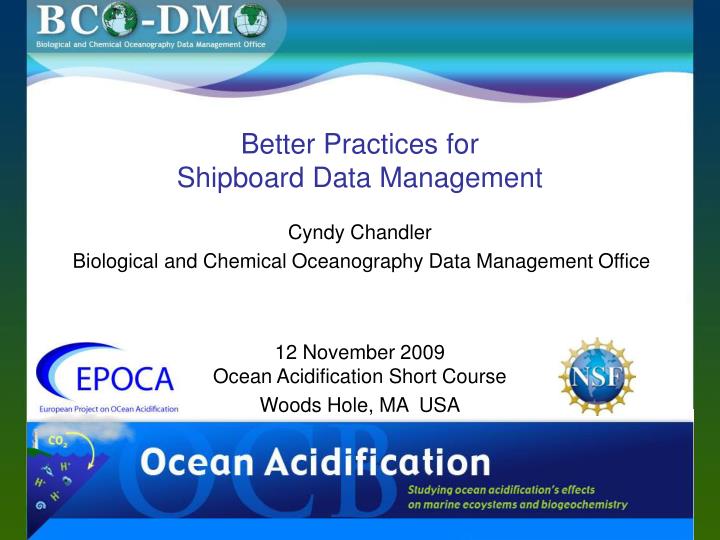
Better Practices for Shipboard Data Management Cyndy ChandlerBiological and Chemical Oceanography Data Management Office 12 November 2009Ocean Acidification Short Course Woods Hole, MA USA slide 1 of 37
Discussion Topics • Research Cruise • Allocation of sample (wire) time • Allocation of sample water • Cruise report • Data inventory • Cruise Sampling Event Log • Data and Metadata Reporting • Data Quality (review) • Metadata and Standards • Data Centers and National Archives slide 2 of 37
What about experiments? • presentation will be specific to cruise activities, but the concepts apply to lab experiments, perturbation or mesocosm experiments slide 3 of 37
EPOCA • European Project on OCean Acidification (EPOCA) • "Guide for Best Practices on Ocean Acidification Research and Data Reporting“available on the EPOCA web site: http://www.epoca-project.eu/index.php/Home/Guide-to-OA-Research/Editors in chief: Ulf Riebesell, Victoria J. Fabry, Jean-Pierre Gattuso slide 4 of 37
Pre-cruise Planning • Station plan • Allocation of sample (wire) time • Allocation of sample water These arrangements should be made prior to the cruise and then reviewed at the first science briefing on board.Have a plan, write it down, communicate it . . .early and often. slide 5 of 37
Cast Plan ~ Sampling Time and Water Allocation slide 6 of 37
Keeping records (recording metadata) • Log Sheets (formal way to record metadata) • station logs • sample logs • Cruise report (cruise metadata) • Data inventory (dataset metadata) • Event log (device deployment metadata) slide 7 of 37
Log Sheet per Sampling Device CTD/Rosette cast slide 8 of 37
Cruise Report • basic cruise metadata • Cruise ID - a way to identify the cruise • KN195-08 (ship, voyage and leg) • KM0908 (ship, 2 digit year and sequential voyage for year) • dates and ports • personnel manifest • list of everyone on board and contact information • their role during the cruise • data inventory • list of who is expecting to collect what data during cruise • event log • list of every device deployment slide 9 of 37
Better Practices for Shipboard Data • Data Management Best Practices Guide compiled by BCO-DMO based on experience from US GLOBEC and US JGOFS • a collection of better practice recommendations for management of data from research cruises • available as a PDF download from:http://bco-dmo.org/resources slide 10 of 37
Data Inventory (list of expected measurements) slide 11 of 37
What is a ‘Cruise Sampling Event Log? • a chronological record of all scientific sampling events that happened during a cruise, wherein each sampling event is assigned a unique identifier Why is an event log important? • event logs with unique sampling event identifiers help to … • integrate observations from the plethora of sampling devices deployed during a cruise • understand relative timing between events slide 12 of 37
a sampling event matrix VERTIGO project KM0414 ALOHA cruise sampling event matrix R/V Kilo Moana (University of Hawaii Marine Center) slide 13 of 37
Why is an event log important? • the unique sampling event identifier helps to integrate observations from discrete data sets • Example: CTD station 4 cast 2 is assigned event number 20080904.1342 … the Niskin bottle nutrient data and pigment data from that cast can be integrated using that event number slide 14 of 37
important event log fields . . . What types of information are important to record in the event log? • the unique sampling event identifier • Example: YYYYMMDD.hhmmYYYYMMDD + time/2400SCYYMMDD.hhmm (SC=ship code) • station and cast number • date and time (UTC) • position (latitude and longitude) slide 15 of 37
other important fields in the event log . . . • instrument [package] type CTD, TM, drifter net, penguin • name of person responsible for sampling event • activity descriptore.g. deployment, recovery start, max depth, end, abort slide 16 of 37
additional possible fields . . . • description of activity and/or comments (free text) e.g. first cast after retermination • local time (important for biology cruise) • timezone • cruise notebook or subsample log page • position relative to a feature (eddy center or treatment patch) slide 17 of 37
controlled vocabulary generated automatically using some algorithm date, time and position from shipboard system shipboard sampling event log event date time time_L sta lon lat ev_type person activity 0212208 20020121 2208 1108 TEST -175.220 -53.572 CTD001 nd CTD001 0230442 20020123 0442 1742 0 -171.480 -55.398 CTD002 Wang CTD002 0231556 20020123 1556 0456 0 -171.583 -55.407 ZooTow Landry ZooplankTow 0232351 20020123 2351 1351 1 -171.521 -55.334 CTD003 nd CTD003 0240153 20020124 0153 1453 1 -171.490 -55.329 TM001 Wang TM001 0240356 20020124 0356 1656 1 -171.336 -55.314 CTD004 Bailey CTD004 0240745 20020124 0745 2045 1 -171.408 -55.335 Pump_Cast Andrews PumpCast01 0241133 20020124 1133 0033 1 -171.405 -55.324 TM002 Wang TM002 0241319 20020124 1319 0219 1 -171.384 -55.333 CTD005 Timothy CTD005 0241435 20020124 1435 0335 1 -171.385 -56.333 HPT Tanner HandPlankTow 0241520 20020124 1520 0420 1 -171.383 -55.337 TM003 Landry TM003 slide 18 of 37
Event Log Data Sources • arrangements were made, agreed upon and reviewed at the first science briefing on board . . . • and everyone agreed on the common data source for: • date and time shipboard network and UTC(not your wristwatch) • position informationdecimal degrees lat/lon(agree on required precision) slide 19 of 37
Final Event Log • should be an electronic file in plain text (TSV or CSV) • many researchers record events on paper logs in the main lab, and then enter the records into Excel • if the original event log entries were made on paper log sheets, scan the originals and convert to PDF • some research vessels support event logging applications, and NSF is funding the development of an event logger for use on UNOLS vessels (R2R project, rvdata.us) slide 20 of 37
Constructing the cruise report . . . Cruise ID manifest data inventory sampling event log slide 21 of 37
Discussion Topics • Research Cruise • Allocation of sample (wire) time • Allocation of sample water • Cruise report • Data inventory • Cruise Sampling Event Log • Data and Metadata Reporting • Data Quality (review) • Metadata and Standards • Data Centers and National Archives slide 22 of 37
Data Quality • Quality Assessment It is important to have a system in place to assure outside users that the analytical results produced are of proven and known quality. (Andrew Dickson, 2009) • to make an assessment of quality we must also keep in mind the time [the data were] collected, the methodology – the capability of the time (A.K. Sinha, Virginia Tech, 2006) • Data Quality involvesquality assurance – done prior to measurementquality control – done after measurement slide 23 of 37
Data Quality • It’s important to understand that reporting on the ‘quality’ of a dataset (a set of measurements) is not a statement about it’s value to the community. • Just because a dataset might be ranked lower on some scale used to assess quality, does not mean it is of less value to the community. • A dataset of known quality is more valuable than one that lacks the quality assessment metadata. slide 24 of 37
Data Quality (of your data) Questions asked during sampling and analysis (related to accuracy and precision*): • How good do I need the measurement? (QA) • How good did I get the measurement? (QC) Data Quality Metadata: • report the questions above and answers with the data • much of this information still fits in the methods section of the peer-reviewed publication – but the problem is that all the data no longer fit in that same publication • important to document the data quality assessment with the published dataset (reported as metadata) slide 25 of 37
Data Quality (of colleague’s data) Thank you to Andrew Dickson (previous lecture) In order to assess ‘fitness for purpose’ important • it helps to know why the measurement was made • ones ability to ascertain ‘good enough’ is related to the uncertainty associated with the measurement • uncertainty relative to your needs as defined by the research topic slide 26 of 37
Metadata • Needed to automate the process of data discovery • like using a library catalog to locate a resource • Needed to determine the fitness of a data set for use • particularly regarding quality (“fitness for purpose”) • Needed to facilitate accurate data interpretation • e.g. units of measurement, data format • Metadata records are expensive to generate • and may require additional expertise to define • But the benefits are substantial • metadata make it possible to find data sets, and use them effectively • they allow the benefits of investments in data to be realized slide 27 of 37
Metadata • in the US, 1995 was the year that state government agencies started devoting resources to metadata capture • motivated by: • 1995 Paperwork Reduction Act (104th US Congress) • Internet and HTML = World Wide Web • desire to automate public access to government documentsfollowing the requirement that agencies establish ‘locator services’ for federal information • Dublin Core Metadata Initiative (2001) slide 28 of 37
Work in Progress . . . There is no cookbook of instructions – or at least the book isn’t finished – and establishing best practices will continue to be iterative. • research themes are becoming more complex • cost of doing research will continue to increase • in situ data can not be collected ‘again’ The water samples collected in March 2009 from 22° 45'N, 158° 00'W can not be collected again. slide 29 of 37
Metadata ~ the goal • document the quality assurance and control measures applied to the measurements during sampling and analysis • what protocols were followed (include reference) • were replicates done, include results of control chart • were inter-comparisons done (analytical techniques, different labs?) • were reference materials used (which ones) • what was done to account for T and P dependencies • were data adjusted based on results of quality control procedures • objective: to report sufficient metadata to support • determination: are these data 'fit for purpose' • accurate re-use of the data • metadata reporting is especially important when the protocols are still being developed (e.g. OA sampling and analytical techniques) • remember local v global (in space and time); resultant data will be used and re-used by colleagues slide 30 of 37
EPOCA • European Project on OCean Acidification (EPOCA) • "Guide for Best Practices on Ocean Acidification Research and Data Reporting“available on the EPOCA web site: http://www.epoca-project.eu/index.php/Home/Guide-to-OA-Research/Editors in chief: Ulf Riebesell, Victoria J. Fabry, Jean-Pierre Gattuso slide 31 of 37
Who’srecording the metadata? Think I’ll go record some metadata. recording metadata at sea . . . is problematic … this is the office ! slide 32 of 37
Metadata matter • ocean acidification research is and will continue to be . . . • expensive (research cruises are resource intensive) • fuel costs • equipment allocation • people time (highly trained people at sea) • collaborative • team projects are more complicated than individual research • important – answers are needed to enable science-based decision support for legislative policies • means the metadata matter more slide 33 of 37
Data management partners: BCO-DMO • metadata forms (http://bcodmo.org/resources ) • Program • Project • Deployment (e.g. cruise) • Dataset metadata contributed with the data • data contributed in any format (often as Excel files) • researchers work in partnership with BCO-DMO staff members to manage data through all phases of a project slide 34 of 37
Standards community adopted standards for . . . • sampling and analytical protocols • assessment of quality assurance and control • metadata content standards • FGDC or ISO may be required by some Data Centers Use of standards can facilitate data integration. At the moment, most of the effort relating to standards is being handled by data centers. slide 35 of 37
Data Centers and National Archives • BCO-DMO • Biological and Chemical Oceanography Data Management Office • for researchers funded by US NSF OCE • CDIAC (Carbon Dioxide Information Analysis Center, Oak Ridge National Laboratory) • NODC • National Oceanographic Data Center • permanent data archive for US researchers funded by NOAA or NSF • analogous *ODC or WDC in other nations slide 36 of 37
Questions? conclusion part 2 of 2 thank you slide 37 of 37
end of day 1 part 2 of total 3 part data management sectionPart 1: Monday, ODV Introduction, Reiner SchlitzerPart 2: Thursday, Data Management: Introduction and Shipboard Data, Cyndy ChandlerPart 3: Friday, Contributing Data to Data Centers, Alex Kozyr slide 38 of 37


![Better Data, Better Science! [ Better Science through Better Data Management ]](https://cdn3.slideserve.com/6850091/better-data-better-science-better-science-through-better-data-management-dt.jpg)