Download
1 / 14
140 likes | 396 Views
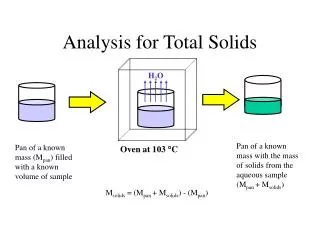
A comparison of filter pads for the analysis of total suspended solids. Bill Romano MD Dept. of Natural Resources Elgin S. Perry, Ph.D. Statistics consultant. Analytical Methods and Quality Assurance Workgroup. 2 June 2009. Current procedures.

E N D
A comparison of filter pads for the analysis of total suspended solids Bill Romano MD Dept. of Natural Resources Elgin S. Perry, Ph.D. Statistics consultant Analytical Methods and Quality Assurance Workgroup 2 June 2009
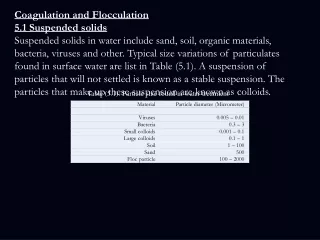
Current procedures • DHMH and DCLS analyze TSS using a pre-rinsed Whatman GF/F 1.5 micron pore size filter pad, as outlined in Standard Methods • CBL uses an un-rinsed Whatman GF/F 0.7 micron filter pad and reports the mean of two pads • ODU also uses a Whatman GF/F 0.7 micron pad, pre-rinses, and has pre-combusted the pads since January 2002
CBL comparison of un-rinsed and rinsed GF/F 0.7 pads • CBL weighed 100 pads straight from the box • The pads were then rinsed with three successive 20 ml rinses of deionized water, dried overnight in a 100 degree Centigrade oven, and re-weighed • It took over one hour and six liters of high quality deionized water to rinse the pads • 150 pads are needed for each main Bay cruise
CBL comparison continued • The difference in weights between un-rinsed and rinsed pads was tested using the Wilcoxon signed rank test • The p-value of 0.2655 was not significant • The arithmetic mean difference between un-rinsed and rinsed pads was -0.000014 grams (rinsed minus un-rinsed) • The CBL balance can only be accurately read to 0.0001 grams
Statistical mumbo jumbo • The observed instrument precision was compared to the analytical precision by calculating the variance of the differences between the un-rinsed and rinsed pads • The calculated variance was divided by two because the variance is additive • The standard deviation of 0.0002 is very close to the analytical precision of 0.0001 • There is no statistical or practical difference between un-rinsed and rinsed pads
Why use a smaller pore size pad • CBL started analyzing main Bay water samples in the mid-1980s • The designers of the main Bay monitoring program were primarily interested in the dissolved fraction of nutrients • A smaller pore size pad does a better job of separating particulate and dissolved fractions of a water sample Particulate Dissolved
The CBL repeated measures study • Carl collected a carboy of water from the CBL pass-through sea water system • Ten samples were drawn from the carboy for “high level” TSS analysis, then split for analysis using un-rinsed 0.7 micron Whatman pads and pre-rinsed, pre-weighed 1.5 micron Environmental Express pads • The remaining water was diluted and eight samples were drawn for “low level” TSS analysis
Statistical mumbo jumbo II • Although a statistical test was probably not needed to see that the TSS concentrations differ based on filter pad pore size, I did one anyway using SAS® PROC ANOVA and the following model statement: • log10TSS = pad level pad*level • The p-value for pad was 0.0006 and the p-value for level was <0.0001
Putting the difference in perspective • CBL analyzes two TSS pads and reports the average • The variability between the CBL pad replicates and the repeated measures study was tested after controlling for variation in the replicate pad data • Mean square errors were used to calculate an F-statistic, which was significant at p<0.0001 • The variability between the replicate pads is greater than the variability between the different pore size pads
A long time ago in a Bay far, far away • DHMH and CBL analyzed split TSS samples collected during December 1999 and May 2000 main Bay cruises • The means for DHMH (1.5 µ) and CBL (0.7 µ) were 10.42 and 10.72 mg/L, respectively for the May 1999 data • Although there is no difference between the concentrations, the p-value from the Wilcoxon signed rank test was significant (p=0.0081) • This was probably a Type I error
Quit while you’re ahead • The May 2000 data have a different pattern than the December 1999 data • The means for DHMH (1.5 µ) and CBL (0.7 µ) were 9.18 and 11.18 mg/L, respectively • These results show that the smaller the pore size the higher the TSS concentration • The Wilcoxon signed rank test indicates the difference between the pads is significant (p<0.0001) • These results include possible differences in laboratory handling
Conclusions • There is no meaningful difference between un-rinsed and rinsed Whatman GF/F 0.7 µ pore size pads • The method for analyzing TSS is old and maybe back then filter pads were not of as high a quality as they are now and they had to be pre-rinsed • There is strong evidence that changing pore size pads will introduce a step trend in the data • Decreasing the number of pads CBL analyzes would represent a savings in time and money • Although measurement error would increase, it is probably a small fraction of the overall error
Questions or comments Photo by William Frece