Download
1 / 43
430 likes | 779 Views
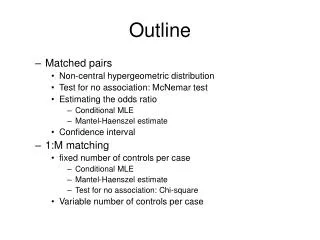
Outline. Matched pairs Non-central hypergeometric distribution Test for no association: McNemar test Estimating the odds ratio Conditional MLE Mantel-Haenszel estimate Confidence interval 1:M matching fixed number of controls per case Conditional MLE Mantel-Haenszel estimate

E N D
Outline • Matched pairs • Non-central hypergeometric distribution • Test for no association: McNemar test • Estimating the odds ratio • Conditional MLE • Mantel-Haenszel estimate • Confidence interval • 1:M matching • fixed number of controls per case • Conditional MLE • Mantel-Haenszel estimate • Test for no association: Chi-square • Variable number of controls per case
Matched Case-Control Studies • Matched case-control study: a fixed number of cases are identified and each identified case is matched with one or more than one controls on the basis of important confounding variables (e.g. , age, sex). • Matched case-control study has more power than unmatched case-control study.
Matched Pair: Example • This example is a matched pair case-control that studies the association of oral contraceptive use with the disease, thromboembolism (blood clots in the veins with inflammation in the vessel walls). The cases were 175 women discharged alive from 43 hospitals after initial attack of thromboembolism. The controls were matched with their cases for hospital, time of hospitalization, race, age, martial status, parity and pay status.
Matched Pair: Original data sta y x 1 1 1 1 0 1 2 1 1 2 0 1 3 1 1 3 0 1 4 1 1 4 0 1 5 1 1 5 0 1 6 1 1 6 0 1 7 1 1 7 0 1 8 1 1 8 0 1 9 1 1 9 0 1 10 1 1 10 0 1 11 1 1 11 0 0 12 1 1 12 0 0 13 1 1 13 0 0 14 1 1 14 0 0 15 1 1 15 0 0 sta y x 16 1 1 16 0 0 17 1 1 17 0 0 18 1 1 18 0 0 19 1 1 19 0 0 20 1 1 20 0 0 21 1 1 21 0 0 22 1 1 22 0 0 23 1 1 23 0 0 24 1 1 24 0 0 25 1 1 25 0 0 26 1 1 26 0 0 27 1 1 27 0 0 28 1 1 28 0 0 29 1 1 29 0 0 30 1 1 30 0 0
Matched Pair: Original data • Q: Can we treat the matched pair case-control data as case-control data, i.e., ignoring the matching and proceed the analysis with the following 2x2 table?
Matched Pair: Original data • A: No. The reason is that the control sample is not a random sample of the control population due to the fact the selection of controls are dependent of cases.
Matched Pair: Example • The 2x2 table that are usually used for the analysis of matched pair data is where x0, x1 be the respective exposure status for the case and control
Matched Pair: transposed data The 2x2 table can be obtained by transposing the original dataset and using proc freq. data match111(keep=sta x0 x1); retain x0 x1; set match11; by sta; if first.sta then x1=x; else do;x0=x;output;end; run; Proc freq data=match111;table x0*x1;run;
Matched Pair: transposed data x0 x1 sta 0 1 16 0 1 17 0 1 18 0 1 19 0 1 20 0 1 21 0 1 22 0 1 23 0 1 24 0 1 25 0 1 26 0 1 27 0 1 28 0 1 29 0 1 30 x0 x1 sta 1 1 1 1 1 2 1 1 3 1 1 4 1 1 5 1 1 6 1 1 7 1 1 8 1 1 9 1 1 10 0 1 11 0 1 13 0 1 14 0 1 15
In general, the data from a matched pair case-control study is usually represented by Matched pair: data representation
Matched pair: Conditional MLEof Odds Ratio • Q: How can we extract information from the 2x2 table on previous slide to estimate the odds ratio measuring the association strength of the exposure with the disease? • A: NOT obvious.
Matched pair: Conditional MLEof Odds Ratio • In order to derive conditional MLE for the odds ratio, we view the data from each pair as a 2x2 table of diseaseXexposure, and consider the probability of observing each table conditional on the row total and column total. The conditional maximum likelihood would be the product of such conditional probabilities.
Let the following 2x2 table represent one of the four tables on previous slide Matched Pair: Non-central Hypergeometric Distribution
Matched pair: Non-central Hypergeometric Distribution • The probability of observing the 2x2 table on the previous slide, conditional on all the marginal totals remaining fixed, is • This is called Non-central Hypergeometric Distribution
Matched pair: Conditional MLEof Odds Ratio • Now let’s apply the non-central hypergeometric distribution to the four 2x2 tables: • The probability of observing • Conditional on row and column totals is
Matched pair: Conditional MLEof Odds Ratio • The probability of observing • Conditional on row and column totals is
Matched pair: Conditional MLEof Odds Ratio • The probability of observing • Conditional on row and column totals is
Matched pair: Conditional MLEof Odds Ratio • The probability of observing • Conditional on row and column totals is
Matched pair: Conditional MLEof Odds Ratio • Let then can be also interpreted as the conditional probability of observing a case-control pair with the case only exposed, given it is discordant.
Matched pair: Conditional MLEof Odds Ratio • The conditional likelihood function of observing all 2x2 tables is (1) • Remark:the data from concordant pairs do not contribute to the likelihood function, that is, the data of concordant pairs contains no information of the odds ratio.
Matched pair: Conditional MLEof Odds Ratio • The conditional MLE of the odds ratio is obtained by maximizing (1) with respect to . That is
Matched pair: Confidence Interval of Odds Ratio • Two steps: 1. Obtain the confidence interval for 2. Use the relationship to convert to the CI for
Matched pair: CMLE and CI of Odds Ratio data match11; set match11; y1=2-y; run; procphreg data=match11; strata sta; model y1 = x / details ties=discrete rl; run;
Matched pair: CMLE and CI of Odds Ratio Analysis of Maximum Likelihood Estimates Parameter Standard Hazard 95% Hazard Ratio Variable DF Estimate Error Chi-Square Pr > ChiSq Ratio Confidence Limits x 1 1.47804 0.30735 23.1265 <.0001 4.384 2.400 8.008
Matched pair: M-H Estimateof Odds Ratio • It is interesting that is also the Mantel-Haenszel common odds ratio estimate applied to the n 2x2 tables
Matched pair: M-H Estimate of Odds Ratio procfreq data=match11 order=data; table sta*x*y/ cmh ; run;
Matched pair: M-H Estimate of Odds Ratio Estimates of the Common Relative Risk (Row1/Row2) Type of Study Method Value 95% Confidence Limits Case-Control Mantel-Haenszel 4.3846 2.4005 8.0085
Matched pair: McNemar’s Test • The null hypothesis is equivalent to . Under the null hypothesis, the Chi-sq statistics, termed McNemar’s Test, has a asymptotic Chi-sq distribution with 1 df.
Matched pair: McNemar’s Test data McNemar; input x1 x0 count ; datalines; 1 1 10 1 0 57 0 1 13 0 0 95 ; procfreq data=Mcnemar order=data; weight count; tables x1*x0/ agree; run;
Matched pair: McNemar’s Test Statistics for Table of case_exposed by control_exposed McNemar's Test Statistic (S) 27.6571 DF 1 Pr > S <.0001
1:M matching: binary exposure • With M matched control per case, there are 2(M+1) possible outcomes depending upon whether or not the case is exposed and upon the number of exposed controls. Each outcome corresponds to one of the 2x2 tables on the next slide
1:M matching: Conditional MLEof Odds Ratio • First we consider the conditional probability of observing the first table and that of observing the last table. We will show that both conditional probabilities are equal to 1. • The 2M remaining tables may be paired into sets of two, each having the same marginal total of exposed. For example, the table with both the case and two controls positive is paired with the table with three controls positive and the case negative.
1:M matching: Conditional MLEof Odds Ratio • The probability of observing • Conditional on row and column totals is
1:M matching: Conditional MLEof Odds Ratio • The 2M remaining tables may be paired into sets of two, each having the same marginal total of exposed. For example, the table with both the case and two controls positive is paired with the table with three controls positive and the case negative.
1:M matching: Conditional MLEof Odds Ratio • The probability of observing • Conditional on row and column totals is
1:M matching: Conditional MLEof Odds Ratio • The probability of observing • Conditional on row and column totals is
1:M matching : Conditional MLEof Odds Ratio • The conditional likelihood function of observing all 2x2 tables is (2)
1:M matching : Conditional MLEof Odds Ratio • The conditional MLE of the odds ratio, , is obtained by maximizing (2) with respect to . Therefore, is the solution of the equation • Unlike the paired case, has no explicit expression, and hence requires iterative numerical calculations.
1:M matching : M-H Estimateof Odds Ratio • A more simply computed estimate is the Mantel-Haenszel common odds ratio estimate applied to the 2(M+1) 2x2 tables
Variable number of controls per case • We will discuss this case in the context of conditional logistic regression, which is the topic of the lecture that follows.