Download
1 / 13
130 likes | 272 Views
Developing a Local Health Inequalities Monitoring Framework. Neil Bendel Health Intelligence Manager Manchester Joint Health Unit. Local Health Inequalities Indicators and Health Equity Audit 10 th March 2003 Crowne Plaza Hotel Liverpool. Background.

E N D
Developing a Local Health Inequalities Monitoring Framework Neil Bendel Health Intelligence Manager Manchester Joint Health Unit Local Health Inequalities Indicators and Health Equity Audit 10th March 2003 Crowne Plaza Hotel Liverpool
Background • Preventing ill-health and improving people’s health and well being is one of the City Council’s Corporate Aims and Objectives • Tackling Health Inequalities is one of the 7 core themes of the Manchester Local Strategic Partnership (LSP). Public Service Agreement (PSA) Target provides overarching objective for LSP. • Work co-ordinated by multi-agency Health Inequalities Partnership (HIQP), representing the PCTs, City Council Departments, Acute Trusts, Health Promotion Service, universities and community groups. • Key task to develop a set of targets and indicators against which progress can be measured, including 3-year and 10-year outcome targets. • Work being led by Manchester Joint Health Unit on behalf of HIQP and the three PCTs
Public Service Agreement (PSA) Target • The Public Service Agreement (PSA) between the City Council and the Government provides an overarching framework for each of the Thematic Partnership areas • PSA Target 11 has a specific focus on life expectancy. The target is: to reduce the gap in life expectancy between Manchester and the England average to 5.1 years for men and 3.6 years for women from an expected gap of 5.6 years and 4.0 years respectively by 2005 • Other PSA Targets (e.g. reducing deaths from road traffic accidents) also have a strong health inequalities dimension • PSA monitored on an regular basis. Need a way of measuring progress towards target and providing feedback to Council Members, senior managers and local people.
Manchester Community Strategy Other Partnership areas Health Inequalities Partnership “To reduce health inequalities in Manchester and between Manchester and the rest of the country” • Corporate Objectives • Life expectancy • CHD & stroke • Respiratory diseases • Other target areas • Cancers • Suicides • Accidents • Teenage pregnancy • Smoking Local Inequalities indicators PSA targets Determinants Lifestyle Services Outcomes Local Inequalities targets
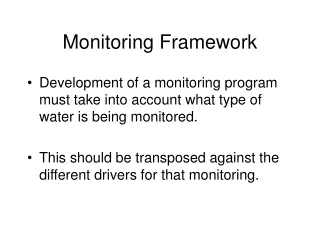
Developing a monitoring framework Aim • To develop a local basket of targets and indicators that are robust and measurable at a local level in order to guide the work of the Health Inequalities Partnership over the next three years Principles • Reflect the wider dimensions and influences on health (e.g. education, housing, employment, transport, crime etc.) • Highlight the contribution that other Thematic Partnerships (e.g. Children & Young People, Housing & Sustainable Communities etc.) are making towards reducing health inequalities within Manchester and between Manchester and the national average • Use information already being collected as part of other local and national datasets, e.g. Best Value Indicators, local departmental indicators, NHS Performance Indicators etc.
Process • Gather together existing indicator sets and information currently collected within them • Identify contacts within each department responsible for collecting/submitting the data • Highlight smaller number of key indicators in terms of relevance to City Council and NHS strategies, data quality and ‘co-terminosity’ • Evaluate indicators against key dimensions of inequalities • Age & gender • Ethnicity • Social group • Geography • Other e.g. disability, special needs • Define specific health inequalities indicators to measure reduction in variations by geographic area or population group
Dimensions of framework • Framework designed to measure changes in those determinants of health that are most likely to lead to an improvement in life expectancy • 8 dimensions: • Health outcomes • Income • Education • Employment • Housing • Transport • Environment • Crime and safety • Broadly relate to the main Thematic Partnerships within the LSP and to the national Tackling Health Inequalities strategy
Provisional Indicators (1) • Health outcomes • Infant mortality • Suicide rate • Accidents mortality rate • Income • % Households in receipt of income support • % Households with children receiving free school meals • Education • % 3 year olds receiving an early years education place • % level 4+ in Key Stage 2 tests • % 5+ GCSE at Grades A*-C • % 16 year olds in full time education/workplace learning • Permanent exclusion rate • Employment • Local unemployment rate
Provisional Indicators (2) • Housing • % of local authority homes that are ‘non-decent’ • % vacant private sector dwellings returned to occupation • Headcount of people sleeping rough • Transport • Number killed or seriously injured (KSI) in road accidents • % increase in use of cycles • Environment • Number of days of moderate or worse air quality • Crime and safety • Domestic burglary rate • Violent crime rate (incl. robberies) • % residents feeling fairly/very safe when out alone after dark
Benefits • Integrated with performance management structure of the Local Strategic Partnership and the PSA • Dimensions of inequalities relevant to local Thematic Partnerships and Council Departments • Emphasises cross-agency contribution to achieving targets around reducing health inequalities • Most data easily available through local authority’s Performance Indicators Management System – PIMS • Provides basis for constructing explicit targets for reducing health inequalities between population groups and geographic areas within Manchester
Key issues • Availability of data • Time periods • Different geographical areas • Population groups (e.g. ethnic minorities) • Small numbers • Changing boundaries / populations • Methodology (e.g. standardisation) • Time lag between intervention and outcome • Making data relevant and meaningful to local communities • Impact of national policy changes
Next steps • Final version of Monitoring Framework to Health Inequalities Partnership meeting in March 2003 for final discussion and agreement • On-going monitoring and review carried out by the LSP Performance Monitoring Group • Formulation of further set of health inequalities targets to measure a reduction in the variations that exist between geographic areas or population groups as opposed to the overall level of health improvement • Development of new summary measures of inequalities within Manchester to support the monitoring of indicators and targets e.g. Robin Hood Index
Contact details Neil Bendel Health Intelligence Manager Manchester Joint Health Unit Room 4041 Town Hall Extension Manchester M60 7LP Phone: (0161) 234 4089 Fax: (0161) 234 3269 E-mail: n.bendel@notes.manchester.gov.uk