Download
1 / 6
60 likes | 217 Views
Sexually Transmitted Disease Surveillance 2009 Division of STD Prevention. STDs in Persons Entering Corrections Facilities. Chlamydia—Positivity by Age and Sex, Juvenile Corrections Facilities, 2009. Men. Positivity. Women. 20. 16. 12. 8. 4. 0. 0. 4. 8. 12. 16. 20. Age. 12.

E N D
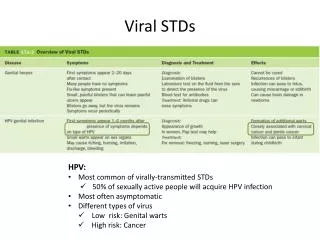
Sexually Transmitted Disease Surveillance 2009 Division of STD Prevention STDs in Persons Entering Corrections Facilities
Chlamydia—Positivity by Age and Sex, Juvenile Corrections Facilities, 2009 Men Positivity Women 20 16 12 8 4 0 0 4 8 12 16 20 Age 12 1.2 4.7 13 1.9 11.2 14 3.5 13.5 15 5.7 15.4 16 7.6 16.2 17 8.2 14.9 18 10.1 13.6 Total 6.6 14.8 NOTE: Positivity percentage is presented from facilities reporting more than 100 test results.
Chlamydia—Positivity by Age Group and Sex, Adult Corrections Facilities, 2009 Men Positivity Women 20 16 12 8 4 0 0 4 8 12 16 20 Age <20 10.8 16.6 20–24 10.0 10.5 25–29 5.1 6.4 30–34 3.6 5.3 >35 1.8 2.3 6.6 7.2 Total NOTE: Positivity percentage is presented from facilities reporting more than100 test results.
Gonorrhea—Positivity by Age and Sex, Juvenile Corrections Facilities, 2009 Men Positivity Women 20 16 12 8 4 0 0 4 8 12 16 20 Age 12 0.1 1.8 13 0.4 3.2 0.4 14 3.7 15 0.7 4.0 1.2 4.4 16 17 1.2 3.4 1.4 18 3.7 Total 1.0 3.9 NOTE: Positivity percentage is presented from facilities reporting more than 100 test results.
Gonorrhea—Positivity by Age Group and Sex, Adult Corrections Facilities, 2009 Men Positivity Women 20 16 12 8 4 0 0 4 8 12 16 20 Age <20 2.2 3.1 20–24 1.7 2.0 25–29 0.8 1.7 30–34 0.8 1.3 >35 0.4 0.7 1.2 1.6 Total NOTE: Positivity percentage is presented from facilities reporting more than 100 test results.
National Center for HIV/AIDS, Viral Hepatitis, STD & TB Prevention Division of STD Prevention