Download
1 / 1
10 likes | 125 Views
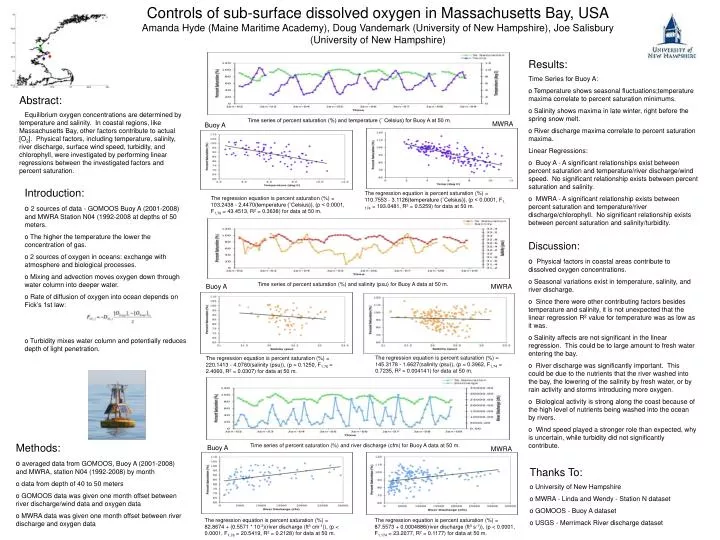
Controls of sub-surface dissolved oxygen in Massachusetts Bay, USA Amanda Hyde (Maine Maritime Academy), Doug Vandemark (University of New Hampshire), Joe Salisbury (University of New Hampshire). Results: Time Series for Buoy A:

E N D
Controls of sub-surface dissolved oxygen in Massachusetts Bay, USA Amanda Hyde (Maine Maritime Academy), Doug Vandemark (University of New Hampshire), Joe Salisbury (University of New Hampshire) • Results: • Time Series for Buoy A: • Temperature shows seasonal fluctuations;temperature maxima correlate to percent saturation minimums. • Salinity shows maxima in late winter, right before the spring snow melt. • River discharge maxima correlate to percent saturation maxima. • Linear Regressions: • Buoy A - A significant relationships exist between percent saturation and temperature/river discharge/wind speed. No significant relationship exists between percent saturation and salinity. • MWRA - A significant relationship exists between percent saturation and temperature/river discharge/chlorophyll. No significant relationship exists between percent saturation and salinity/turbidity. Abstract: Equilibrium oxygen concentrations are determined by temperature and salinity. In coastal regions, like Massachusetts Bay, other factors contribute to actual [O2]. Physical factors, including temperature, salinity, river discharge, surface wind speed, turbidity, and chlorophyll, were investigated by performing linear regressions between the investigated factors and percent saturation. Time series of percent saturation (%) and temperature (˚ Celsius) for Buoy A at 50 m. MWRA Buoy A • Introduction: • 2 sources of data - GOMOOS Buoy A (2001-2008) and MWRA Station N04 (1992-2008 at depths of 50 meters. • The higher the temperature the lower the concentration of gas. • 2 sources of oxygen in oceans: exchange with atmosphere and biological processes. • Mixing and advection moves oxygen down through water column into deeper water. • Rate of diffusion of oxygen into ocean depends on Fick’s 1st law: • Turbidity mixes water column and potentially reduces depth of light penetration. The regression equation is percent saturation (%) = 110.7553 - 3.1126(temperature (˚Celsius)), (p < 0.0001, F1, 174 = 193.0481, R2 = 0.5259) for data at 50 m. The regression equation is percent saturation (%) = 103.2438 - 2.4470(temperature (˚Celsius)), (p < 0.0001, F1,76 = 43.4513, R2 = 0.3638) for data at 50 m. • Discussion: • Physical factors in coastal areas contribute to dissolved oxygen concentrations. • Seasonal variations exist in temperature, salinity, and river discharge. • Since there were other contributing factors besides temperature and salinity, it is not unexpected that the linear regression R2 value for temperature was as low as it was. • Salinity affects are not significant in the linear regression. This could be to large amount to fresh water entering the bay. • River discharge was significantly important. This could be due to the nutrients that the river washed into the bay, the lowering of the salinity by fresh water, or by rain activity and storms introducing more oxygen. • Biological activity is strong along the coast because of the high level of nutrients being washed into the ocean by rivers. • Wind speed played a stronger role than expected, why is uncertain, while turbidity did not significantly contribute. Buoy A MWRA Time series of percent saturation (%) and salinity (psu) for Buoy A data at 50 m. The regression equation is percent saturation (%) = 220.1413 - 4.0760(salinity (psu)), (p = 0.1250, F1,76 = 2.4060, R2 = 0.0307) for data at 50 m. The regression equation is percent saturation (%) = 145.3178 - 1.6627(salinity (psu)), (p = 0.3962, F1,74 = 0.7235, R2 = 0.004141) for data at 50 m. • Methods: • averaged data from GOMOOS, Buoy A (2001-2008) and MWRA, station N04 (1992-2008) by month • data from depth of 40 to 50 meters • GOMOOS data was given one month offset between river discharge/wind data and oxygen data • MWRA data was given one month offset between river discharge and oxygen data Buoy A Time series of percent saturation (%) and river discharge (cfm) for Buoy A data at 50 m. MWRA • Thanks To: • University of New Hampshire • MWRA - Linda and Wendy - Station N dataset • GOMOOS - Buoy A dataset • USGS - Merrimack River discharge dataset The regression equation is percent saturation (%) = 82.8674 + (0.5571 * 10-3)(river discharge (ft3 cm-1)), (p < 0.0001, F1,76 = 20.5419, R2 = 0.2128) for data at 50 m. The regression equation is percent saturation (%) = 87.5573 + 0.0004886(river discharge (ft3 s-1)), (p < 0.0001, F1,174 = 23.2077, R2 = 0.1177) for data at 50 m.