Download
1 / 14
140 likes | 291 Views
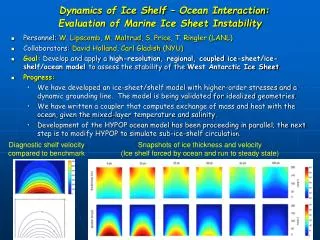
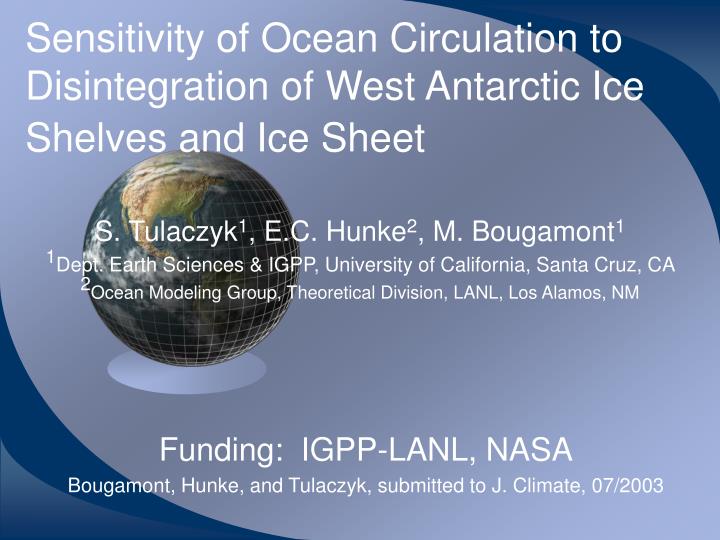
Sensitivity of Ocean Circulation to Disintegration of West Antarctic Ice Shelves and Ice Sheet. S. Tulaczyk 1 , E.C. Hunke 2 , M. Bougamont 1 1 Dept. Earth Sciences & IGPP, University of California, Santa Cruz, CA 2 Ocean Modeling Group, Theoretical Division, LANL, Los Alamos, NM.

E N D
Sensitivity of Ocean Circulation to Disintegration of West Antarctic Ice Shelves and Ice Sheet S. Tulaczyk1, E.C. Hunke2, M. Bougamont1 1Dept. Earth Sciences & IGPP, University of California, Santa Cruz, CA 2Ocean Modeling Group, Theoretical Division, LANL, Los Alamos, NM Funding: IGPP-LANL, NASA Bougamont, Hunke, and Tulaczyk, submitted to J. Climate, 07/2003
Outline • Ocean circulation model (CICE-POP) • WA ice shelves and sheet removed • Perturbations to ocean circulation analyzed • Significant changes observed
Justification Can changes in the extent of WA ice trigger rearrangements in ocean circulation (e.g., Denton, 1999)? This question is relevant to concerns about WA stability, past break-ups of WAIS (MIS11?), preglacial period in WA (~5 M.yr ago).
Some model characteristics • POP = Parallel Ocean Program (LANL, ~2-3 deg. global grid, 25 depth levels, no salinity restoration) • CICE = Sea-ice model (LANL, 3 deg. global grid) • Coupled with CCSM coupler (cpl5) • Atmospheric forcing = a 10-year cycle of atmospheric forcing data (1979-1988) modified by an atmospheric mixed-layer parametrization • Each run is 40 model years (2 week run on 36 processors) • All results shown are averaged over the last decade More potential limitations than you can shake a stick at, but we just want to see simulated response to a perturbation We ignore freshwater release during break up, steady-state is reached only in the upper part of the ocean (40 years), …
Control Run Grid No-Ice-Shelves Grid No-WAIS Grid
What is shown? - Vertical water circulation (positive = clockwise circulation cells, negative = anticlockwise circulation cells) Ross Sea = upwelling weakens, Weddell Sea = downwelling weakens
What is shown? - Vertical water circulation (positive = clockwise circulation cells, negative = anticlockwise circulation cells) a = control case, b = no-shelves less control case, c = no-WAIS less control case Results: strengthening of southern bottom circulation, weakening in N. Atlantic
What is shown? - Total mass transport (vertically and longitudinally averaged) Positive = northward transport Negative = southward transport Results: Southward transport in the S. IP Ocean strengthens Northward transport in Atlantic weakens Black = control, Green = no-shelves, Red = no-WAIS
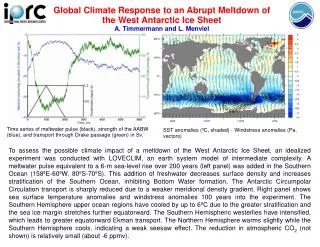
What is shown? - Meridional heat transport in Peta Watts (positive = northward heat transport, negative = southward heat transfer) For reference: ~0.02 PW melts all annual Antarctic mass gain Solid lines: black = control case, green = no-shelves, red = no-WAIS Dashed lines (differences): green = no-shelves less control, red = no-WAIS less control Results: increase in southward heat transport, decrease in northward heat transport (Atlantic)
What is shown? - Sea Surface Temperatures (differences between experiments and control) Green = no-shelves less control (globally), red = no-WAIS less control (globally), blue = no-shelves less control (Atlantic only), pink = no-WAIS less control (Atlantic only) Results: surface cooling in Southern Ocean and North Atlantic
Important Observations Within 40 model years: • Changes in WA land- and shelf-ice extent perturb ocean circulation significantly (sea-ice production and polynyas) • Sea-ice production increases and polynyas shift • Downwelling around Antarctica increases by 1-2 Sv • S. Ocean bottom circulation cell strengthens by up to ~30%, N. Atlantic cell weakens by up to ~10% • Mass and heat transfers toward Antarctica increase but toward N. Atlantic decrease • Sea Surface Temperatures drop by up to 0.8C in the S. Ocean and by up to 0.2C in N. Atlantic
Conclusion • Changes in WA land- and shelf-ice extent may introduce decadal-scale rearrangement in ocean circulation and climate
Future needs • Address this problem using a fully-coupled ice-ocean-atmosphere model at better spatial resolution (polynyas) and over model time spans ~100-1000 years