Download
1 / 19
190 likes | 296 Views
Chapter 1 Section 6. Collecting Data. Sampling Criteria. Good sample is: Representative of the larger population. Selecting at random, and Large enough to provide accurate data. A survey can be biased and give false results if the sampling criteria are not followed.

E N D
Chapter 1 Section 6 Collecting Data
Sampling Criteria Good sample is: • Representative of the larger population. • Selecting at random, and • Large enough to provide accurate data.
A survey can be biased and give false results if the sampling criteria are not followed. • Note that there is no given number to make the sample large enough. • You must consider each situation individually.
Example 1 One hundred people in Lafayette, California, were to eat a bowl of oatmeal every day for a month to see whether eating a healthy breakfast daily could help reduce cholesterol. After 30 days, 98 of those in the sample had lower cholesterol. Is this a good sample? Explain.
Example 1 Continued • If the people were randomly chosen, then this is a good sample. Also, the sample appears to be large enough to be representative of the population. For example, the results of two of three people would not have been enough to make any conclusions.
Your Turn Determine whether each is a good sample. Explain. Two hundred students at each school basketball game are surveyed to find the students favorite sport. No, many of those surveyed would prefer basketball.
Your Turn Determine whether each is a good sample. Explain. Every other person leaving a supermarket is asked to name their favorite soap. Yes, people buy soap at a supermarket.
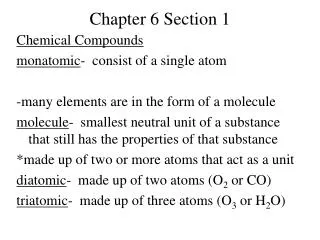
One way to organize data is using a frequency table. In a frequency table, you use tally marks to record and display the frequency of events.
Example 2 • In an experiment, students “charged” balloons by rubbing them with wool. They placed the balloons on a wall and counted the number of seconds they remained. The class results are shown in the chart at the right. Make a frequency table to organize the data.
Step 1: Make a table with the three columns: Time (s), Tally, and Frequency. Add a title. • Step 2: It is sometimes helpful to use intervals so there are fewer categories. In this case, we are using intervals of size 10.
Step 3: Use the tally marks to record the times in each interval. • Step 4: Count the tally marks in each row and record this number in the Frequency column.
Your Turn • Make a frequency table to organize the data in the chart below.
In Example 2, suppose the science teacher wanted to know how many balloons stayed on the wall no more that 44 seconds. To answer this question, use a cumulative frequency table in which the frequencies are accumulated for each item.
From the cumulative frequency table, we see that 24 balloons stayed on the wall for 44 seconds or less. Or, 24 balloons stayed on the wall no more than 44 seconds. 8 + 9 = 17 17+ 7 = 24 24 + 1 = 25
Once you have summarized data in a frequency table of in a cumulative frequency table, you can analyze the information and make conclusions.
Example 3 • Owners of a fast food restaurant are looking for a new location. They counted the number of people who passed by the proposed location one day during lunchtime. The frequency table on the next slide shows the results of their sampling.
A. Which two groups of people passed by the location most frequently? Adults in their 30s and 40s B. If the restaurant is an ice cream shop aimed at teens during their lunchtimes, is this a good location for the restaurant? Explain. Since very few teens pass by the location compared to adults, the owners should probably look for another location.