Download
1 / 34
350 likes | 489 Views
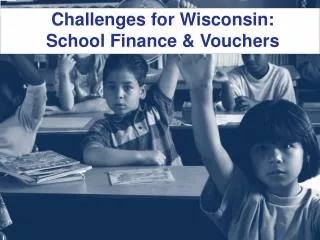
Challenges for Wisconsin: School Finance & Vouchers. Road Map. Growing Poverty & Economic Challenges Changing Enrollment & Demographics School Finance Funding Charter Schools & Vouchers Is There A Better Way Forward For All Kids?. Growing Poverty & Economic Challenges.

E N D
Road Map • Growing Poverty & Economic Challenges • Changing Enrollment & Demographics • School Finance • Funding Charter Schools & Vouchers • Is There A Better Way Forward For All Kids?
Poverty is Growing in WI…Change in Free & Reduced Lunch (2001-2012) Wisconsin FRL Rate Doubles 2001: 21%2012: 43% In many rural districts, more than half the students are eligible for free-and-reduced lunch. Source: Wisconsin Department of Public Instruction. School Finance Maps. http://dpi.wi.gov/sfs/maps.html
And so are the # of Homeless Kids… Half of Wisconsin’s homeless kids can be found in just 10 school districts. Source: Wisconsin Department of Public Instruction. Homeless Children and Youth data: http://homeless.dpi.wi.gov/hmls_data
And Poverty Impacts Achievement(2012-13 Report Card Data) HIGH-poverty, LOW-performing schools LOW-poverty, HIGH-performing schools Avg. FRL There is a very strong correlation between poverty and school performance. Source: Wisconsin Department of Public Instruction. School and District Report Cards http://reportcards.dpi.wi.gov/
Students are in Fewer DistrictsChange Student Membership (2001-2012) In 2001, 1/3rd of districts were in declining enrollment. By 2012, over 2/3rds districts were in declining enrollment. Today, 75% of our students are located in just 30% of our districts. Wisconsin FRL Rate Doubles 2001: 21%2012: 43% Source: Wisconsin Department of Public Instruction. School Finance Maps. http://dpi.wi.gov/sfs/maps.html
Which Means Rural Districts Have Fewer Kids & Greater Poverty Wisconsin FRL Rate Doubles 2001: 21%2012: 43% Source: Wisconsin Department of Public Instruction. School Finance Maps. http://dpi.wi.gov/sfs/maps.html
Wisconsin is also Increasingly Diverse… Source: Wisconsin Department of Public Instruction & University of Wisconsin –Madison, Applied Population Laboratory. Raw Data Source: National Center for Education Statistics (NCES) 2009. http://nces.ed.gov/
And Students of Color are More Likely to Attend a Low-Performing School Source: Wisconsin Department of Public Instruction. School and District Report Cards http://reportcards.dpi.wi.gov/
…And Rural Schools Face Specific Challenges • Rural schools face specific challenges, such as: • Declining enrollment; • Growing poverty; • Staff shortages; • Higher transportation costs; and • Increasing numbers of English Language Learners (ELL). • Small schools have less economy of scale, making technology and infrastructure investments more expensive (fewer students to absorb costs). • Rural districts generally have fewer support staff and administrators (the superintendent often is a principal and business administrator), meaning there fewer staff to implement state and federal initiatives. • Rural educators often receive lower compensation and wear many hats, requiring high levels of certification and commitment.
Ten Largest State Programs (General Fund) Category% of State Budget 1. K-12 General and Categorical School Aids ($5.2 billion) 32.4% 2. Medical Assistance 15.1% 3. University of Wisconsin System Operations 7.0% 4. State Correctional Operations 6.4% 5. School Levy/First Dollar Tax Credits ($897.4 million) 5.6% • Shared Revenue Payments (Aid to Municipalities) 5.3% • Technical College System Aids 3.2% 8. Appropriation Obligation Bonds 2.5% 9. Local Community/Juvenile Correctional Services 1.9% • State Judicial/Legal Services 1.6% Everything else (agency operations, choice programs, etc.) 19% Source: Legislative Fiscal Bureau
However, the share of the state budget spent on K-12 is at a 20-year low As programs like Medicaid consume a larger share of the state budget, K-12’s share declines (even as the state invests new money) Source: Legislative Fiscal Bureau
2012-13 Wisconsin School Revenue • 88% of schools funds come from state and local sources. • State and local funding efforts are roughly split 50-50. $10.7 Billion Source: Wisconsin Department of Public Instruction. School District Revenue Limits http://sfs.dpi.wi.gov/sfs_revlim 2013-15 State Budget. http://news.dpi.wi.gov/news_2013-15-state-budget-information
School Funding – Simplified! Outside the Revenue Limit
During the Great Recession, Revenue Limits Were Cut … Source: Department of Public Instruction. 2011-13 State Budget. http://pb.dpi.wi.gov/pb_11-13_budget 2013-15 State Budget. http://news.dpi.wi.gov/news_2013-15-state-budget-information
And for 20 Years State AidHas Not Kept Pace With Inflation • After accounting for inflation, general aid per pupil was at least $500 less in 2011-12 than it was in 2000-01. Source: Department of Public Instruction. 2011-13 State Budget. http://pb.dpi.wi.gov/pb_11-13_budget 2013-15 State Budget. http://news.dpi.wi.gov/news_2013-15-state-budget-information
While Categorical Aid Reimbursement Rates Have Fallen • Reimbursement rates for special education (36% to 26%) and bilingual-bicultural (18% to 8%) services have dropped 10 percentage points since 2000-01. Source: Department of Public Instruction. 2011-13 State Budget. http://pb.dpi.wi.gov/pb_11-13_budget 2013-15 State Budget. http://news.dpi.wi.gov/news_2013-15-state-budget-information
Which has Resulted in Significant Staff Reductions Wisconsin schools cut more than 3,000 educatorsduring the Great Recession. Source: Department of Public Instruction. 2011-13 State Budget. http://pb.dpi.wi.gov/pb_11-13_budget 2013-15 State Budget. http://news.dpi.wi.gov/news_2013-15-state-budget-information
Most Kids Attend Public School Total Enrollment (2013-14) Public Schools: 875,000 Private Schools: 120,000 Source: Department of Public Instruction. Public School Enrollment Data http://lbstat.dpi.wi.gov/lbstat_pubdata3Private School Enrollment Data http://lbstat.dpi.wi.gov/lbstat_privdata
Charter Schools & Independent (2r) Charters Schools In 2013-14, Wisconsin had: • 242 charters schools with • 47,600 students. Charters are public schools that are generally authorized by the local school board. However, Milwaukee and Racine have independentcharter schools that are created by: • UW – Milwaukee (12) • City of Milwaukee (10) • UW – Parkside (1) • Milwaukee Area Technical College (0) The 23 Independent (2r) charter schools enroll 8,400 students, but are funded differently. Independent charter schools are 100% state funded (no property tax), but only receive $7,925 per-pupil ($8,075 in 14-15). However, this state funding is created by withholding ≈1.4% of every district’s general aid and redirecting it to the independent charters. Local districts then can increase their property taxes to make up the difference – essentially raising property taxes statewide. Source: Department of Public Instruction. Charter Schools in Wisconsin. http://sms.dpi.wi.gov/sms_csindex
Voucher Programs Started Small, But Have Grown Over Time In 1998, the State Supreme Court ruled that religious schools could participate in the voucher program. In 1990-91, the Voucher Program cost ≈ $734,000 In 2014-15, the Voucher Program will cost: ≈ $212,000,000 Source: Department of Public Instruction. Private School Choice Programs - Facts & Figures. http://sms.dpi.wi.gov/choice_facts_statistics
Most Students in Voucher Schools are Publicly-Funded • Milwaukee PCP average:79% • Racine PCP average: 44% • Wisconsin PCP average: 4% • All PCP schools average: 64% The % of voucher-funded students in participating schools (particularly K-8 schools) tends to grow over time. Source: Department of Public Instruction. Private School Choice Programs - Facts & Figures. http://sms.dpi.wi.gov/choice_facts_statistics
…And Most Statewide Voucher Students Came From Private Schools 2013-14 Statewide Choice Program Enrollment: 2/3rds of the students were already enrolled in private schools Source: Department of Public Instruction. Private School Choice Programs - Facts & Figures. http://sms.dpi.wi.gov/choice_facts_statistics
However, Voucher Schools Still Get Less Per-Pupil Funding Per-Pupil Revenue Authority by School Type Public school revenue has not caught up to the 2010 funding level. Source: Department of Public Instruction. 2013-15 State Budget Information. http://news.dpi.wi.gov/news_2013-15-state-budget-information
A Voucher in Every Backpack? What would universal vouchers with public school funding parity cost? Let’s do the math… Total additional (marginal) cost for universal vouchers: • $ 1,026,116,318 ($1 billion) Source: Department of Public Instruction. 2013-15 State Budget Information. http://news.dpi.wi.gov/news_2013-15-state-budget-informationNote: calculations are updated to determine marginal, rather than total program costs.
Overall, Students Perform Similarly Across Sectors Source: Department of Public Instruction. “Last year for WKCE math and reading; results improve over five years.” http://news.dpi.wi.gov/files/eis/pdf/dpinr2014_47.pdf “Fourth Year of Choice Data.” http://news.dpi.wi.gov/files/eis/pdf/dpinr2014_48.pdf
Legislative Efforts Here are some legislative proposals that address these issues: • Fair Funding School Finance Proposal (State Superintendent Evers’ 2013-15 State Budget proposal) • Voucher School Report Cards (Passed)(2013 SB 286 – Sen. Olsen, Rep. Kestell) • Increasing Special Education & Sparsity Reimbursement Rates(2013 AB 772 – Rep. Mason; 2013 AB 834 Rep. Clark) • Pre-Accreditation for Voucher Schools (Passed) (2013 SB 584 – Sen. Vukmir) • Rural Teacher Loan Forgiveness(2013 AB 817 – Rep. Wright) • Restoring 2/3rds State Funding for Education(2009 AB 919 – Reps. Davis, Strachota, Brooks, Honadel, Kestell, Kleefisch, Knodl, LeMahieu, Lothian, Townsend and Vos)
Bottom Line Wisconsin must meet the challenge of growing poverty and increasingly diverse classrooms. • Students and families have more options and choices than ever before (neighborhood schools, charters, vouchers, open enrollment, or virtual charters). • But we have to close our achievement gaps and expand personalized learning for all students. • And rural schools deserve the resources to meet the needs of their students without continuous referenda. Together, we can do better….