Download
1 / 38
380 likes | 514 Views
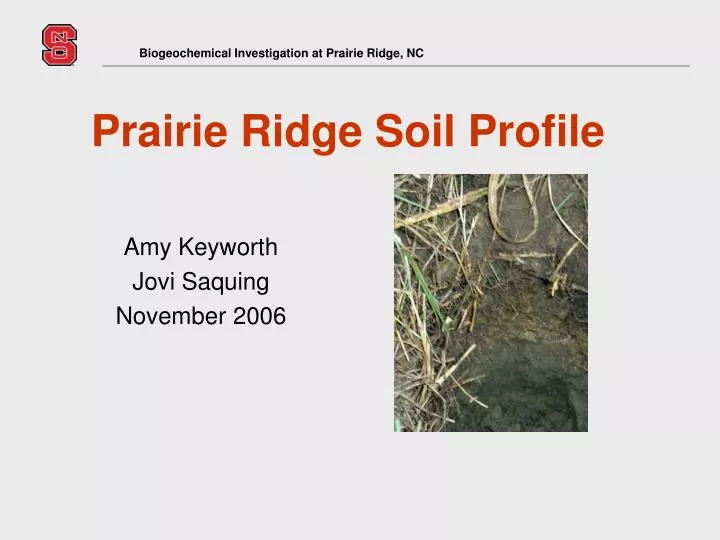
Biogeochemical Investigation at Prairie Ridge, NC. Prairie Ridge Soil Profile. Amy Keyworth Jovi Saquing November 2006. Outline. Prairie Ridge Soil Profile. What we expect to see… and why? What we do see… and how come? What can we conclude?. Litter (undecomposed).

E N D
Biogeochemical Investigation at Prairie Ridge, NC Prairie Ridge Soil Profile Amy Keyworth Jovi Saquing November 2006
Outline Prairie Ridge Soil Profile • What we expect to see… and why? • What we do see… and how come? • What can we conclude?
Litter (undecomposed) Organic layer, fermented Organic layer, humified Mineral layer with organic carbon and leached minerals Mineral layer with precipitation of oxides/hydroxides and/or carbon Unaltered parent substrate Source: Gleixner, G. 2005. Stable isotope composition of soil organic matter. In Stable isotopes and biosphere-atmosphere interactions. ed. Flanagan, L.B., E.J. Ehleringer and D.E. Patake. Soil Profile Description Prairie Ridge Soil Profile
Organic Compounds Prairie Ridge Soil Profile Cellulose Lipid Lignin Protein Monosaccharide (e.g. glucose) Amino acid Lignin monomers Intermediates (e.g. acetic acid) Ammonium Alkanes Nitrites/Nitrates CO2 Humic Substances N2, N2O Source: Gleixner, G. 2005. Stable isotope composition of soil organic matter. In Stable isotopes and biosphere-atmosphere interactions. ed. Flanagan, L.B., E.J. Ehleringer and D.E. Patake.
Organic Compounds Prairie Ridge Soil Profile Cellulose Lignin Lignin Monomers Alkanes
What we expect to see.. Prairie Ridge Soil Profile • 13C – increase with depth • C/N – decrease with depth • % C – decrease with depth • % N – increase/decrease with depth • Carboxylic and aromatic groups – present in organic layers, increasing aromaticity with depth
Valley Lower Slope Upper Slope Ridge Top What we expect to see - 13C Prairie Ridge Soil Profile Carbon isotopic composition profiles. Undisturbed site Disturbed (agricultural) site (Fig 2 middle, J.G. Wynn, et al., 2006)
What we expect to see – [C] Prairie Ridge Soil Profile Carbon concentration profiles. Undisturbed site Disturbed (agricultural) site “Kink” in the C(z) curve reflects root depth or productivity zone (Fig 2. Top, J.G. Wynn, et al., 2006)
What we expect to see – C/N Prairie Ridge Soil Profile Source: C/N of soil organic matter from different depth intervals (Gleixner, 2005)
Why do we expect to see it ? Prairie Ridge Soil Profile • Suess effect • Soil carbon mixing • Preferential microbial decomposition • Kinetic fractionation
Why we expect to see it ? Prairie Ridge Soil Profile • Suess effect • Soil carbon mixing • Preferential microbial decomposition • Kinetic fractionation
Suess effect Prairie Ridge Soil Profile • Older, deeper SOM originated when atmospheric 13C was more positive (CO2 was heavier) • From 1744 to 1993, difference in 13C app -1.3 ‰ • Typical soil profile differences = 3 ‰
1. Suess effect Prairie Ridge Soil Profile Mixing of SOC derived from the modern atmosphere versus that derived from a pre-Industrial Revolution atmosphere. (Fig. 1A, J.G. Wynn, et al., 2006)
Why we expect to see it ? Prairie Ridge Soil Profile • Suess effect • Soil carbon mixing • Preferential microbial decomposition • Kinetic fractionation
2. Soil carbon mixing Prairie Ridge Soil Profile • Surface litter (depleted) vs. root derived (enriched) SOM Mixing of leaf litter-derived SOC and root-derived SOC. (Fig. 1B, J.G. Wynn, et al., 2006)
2. Soil carbon mixing Prairie Ridge Soil Profile • Variable biomass inputs (C3 vs. C4 plants) Mixing of SOC formed under two different vegetation communities, e.g. C3 vs C4. Slope could vary from positive to negative depending on direction of shift. (Fig. 1C, J.G. Wynn, et al., 2006)
2. Soil carbon mixing Prairie Ridge Soil Profile • Some of the carbon incorporated into SOM by these critters has an atmospheric or soil gas, not SOM, source. • Atmospheric C is heavier. Atmospheric CO2 in the soil is 4.4 ‰ heavier than CO2 metabolized by decomposition (Wedin, 1995)
Why we expect to see it ? Prairie Ridge Soil Profile • Suess effect • Soil carbon mixing • Preferential microbial decomposition • Kinetic fractionation
3. Preferentialmicrobial decomposition Prairie Ridge Soil Profile • Lipids, lignin, cellulose - 13C depleted with respect to whole plant • Sugars, amino acids, hemi-cellulose, pectin - 13C enriched • Lipids and lignin are preferentially accumulated in early decomposition • Works against soil depth enrichment • More C than N are lost from soil as SOM decomposes due to internal recycling of N.
Why we expect to see it ? Prairie Ridge Soil Profile • Suess effect • Soil carbon mixing • Preferential microbial decomposition • Kinetic fractionation
4. Kinetic fractionation Prairie Ridge Soil Profile • Microbes choose lighter C • Microbial respiration of CO2 – 12C preferentially respired • Frequently use Rayleigh distillation analyses (Wynn 2006) • No direct evidence for this (Ehleringer 2000) • Preferential preservation of 13C enriched decomposition products of microbial transformation
4. Kinetic fractionation Prairie Ridge Soil Profile 13C distillation during decomposing SOM. The gray lines show the model with varying fractionation factors from 0.997 to 0.999. (Fig. 1D, J.G. Wynn, et al., 2006)
4. Kinetic fractionation Prairie Ridge Soil Profile Assumptions by Wynn etal • Open system • All components decompose • Contribute to soil-respired CO2 at same rate with depth • FSOC fSOC Rayleigh distillation • F fraction of remaining soil organic matter (SOC) – approximated by the calculated value of fSOC • 13Cf isotopic composition of SOC when sampled • 13Ci isotopic composition of input from biomass • α fractionation factor between SOC and respired CO2 • e efficiency of microbial assimilation • t fraction of assimilated carbon retained by a stabilized pool of SOM
Anthropogenic mixing (agriculture) Prairie Ridge Soil Profile Various reasons that disturbed land might not conform to nice regression curve in Fig 1D (Wynn fig 9 ) A – natural B – introduce C4 plants, enriched in 13C C – Cropping – removes new, low 13C material, leading to surface enrichment D – Erosion – removes upper layer, moving the whole curve up E – Reintroduce soil organic carbon (better management practices) – reverses the trends in B, C, and D
Prairie Ridge Soil Profile What we do see - results
What we do see - results Prairie Ridge Soil Profile • 13C – increase 3‰ from surface to 8 cm • C/N – increases to 8 cm, then decreases • % C – decrease with depth • % N – decrease with depth
What we do see - 13C Prairie Ridge Soil Profile Increase of 3‰ from surface to 8 cm (PRS 18 = anomaly)
What we do see – C/N Prairie Ridge Soil Profile Increase of from surface to 8 cm then decreases
What we do see – C% Prairie Ridge Soil Profile Decrease with depth
What we do see – N% Prairie Ridge Soil Profile Decrease with depth
Prairie Ridge Soil Profile • PRS 7 and PRS 15, both surface soils, have similar absorbencies • All soils have peak at wavelength 1032 • All 5 spectra have similar peaks, though not necessarily similar absorbencies • In our bulk and heavy samples, are the mineral spectra masking the organics, as in Poirier’s M-SOM?
Prairie Ridge Soil Profile Si-O O-H Aliphatic C-H C=C,C=O, N-H
Problems with Methods Prairie Ridge Soil Profile • Haphazard protocol on soil sampling at the site (i.e. depth interval, mass of soil) • Inconsistent sample preparation procedure (i.e. different mass, subjective sorting) • Poor implementation of IRMS protocols (i.e. sample size, standard calibration) • Insufficient samples for statistical accuracy
Conclusions Prairie Ridge Soil Profile • 13C – increase 3‰ to 8 cm as expected • C/N – decreases in lower portion of profile as expected • % C – decrease with depth as expected • % N – decrease with depth
Conclusions Prairie Ridge Soil Profile • Don’t have enough samples or rigorous sampling method • Many studies examine only the organic layer – 5 cm only • Minerals swamp the organics in our FTIR results • Look at methods to extract organics
References Prairie Ridge Soil Profile • Antil, R.J., Gerzabek, M.H., Haberhauer, G. and Eder, G. 2005. Long-term effects of cropped vs. fallow and fertilizer amendments on soil organic matter I. Organic carbon. J.Plant Nutr.Soil Sci., 168, 108-116. • Ehleringer, James R., Buchmann, N., Flanagan, L.B., 2000 Carbon Isotope Ratios in Belowground Carbon Cycle Processes, Ecological Applications, vol. 10, no. 2, p. 412-422 • Gerzabek, M.H., Antil, R.S., Kogel-Knabner, I., Knicker, H., Kirchmann, H., and G. Haberhauer. 2006. How are soil use and management reflected by soil organic matter characteristics: a spectroscopic approach. European Journal of Soil Science, 57, 485-494. • Gleixner, G. 2005. Stable isotope composition of soil organic matter. In Stable isotopes and biosphere-atmosphere interactions. ed. Flanagan, L.B., E.J. Ehleringer and D.E. Patake. • Haberhauer, G., Rafferty, B., Strebl, F. and Gerzabek, M.H. 1998. Comparison of the composition of forest soil litter derived from three different sites at various decompositional stages using FTIR spectroscopy. Geoderma 83, 331-342. • Johnson, M.D., Huang, W. and Weber Jr., W.J. 2001. A distributed reactivity model for sorption by soils and sediments. 13. Simulated diagenesis of natural sediment organic matter and its impact on sorption/desorption equilibria. Environ. Sci. Technol. 35, 1680-1687.
References Prairie Ridge Soil Profile • Melillo, Jerry M., Aber, J.D., Linkins, A.E., Ricca, A., Fry, B., Nadelhoffer, K.J., 1989, Carbon and nitrogen dynamics along the decay continuum: Plant litter to soil organic matter, Plant and Soil, vol. 115, p. 189-198 • Poirier, N., Sohi, S.P., Gaunt, J.L., Mahieu, N., Randall, E.W., Powlson, D.S., Evershed, R.P., 2005, The chemical composition of measurable soil organic matter pools, Organic Geochemistry, vol. 36, p. 1174-1189 • Still, C.J., Berry, J.A., Ribas-Carbo, M. and Helliker, B.R. 2003, The contribution of C3 and C4 plants to the carbon cycle of a tallgrass prairie: an isotopic approach. Ocecologia 136:347-359. • Wedin, David A., Tieszen, L.L., Dewey, B., Pastor, J., 1995, Carbon Isotope Dynamics During Grass Decomposition and Soil Organic Matter Formation, Ecology, vol. 76, no. 5, p. 1383-1392 • Wynn, J.G., Harden, J.W., Fries, T.L., 2006, Stable carbon isotope depth profiles and soil organic carbon dynamics in the lower Mississippi Basin, Geoderma, vol. 131, p. 89-109