Download
1 / 70
700 likes | 1k Views
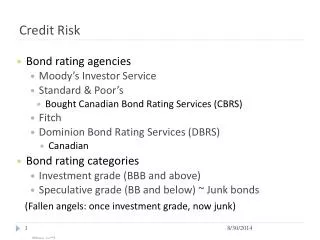
Credit Risk. Chapter 22. Credit Ratings. In the S&P rating system, AAA is the best rating. After that comes AA, A, BBB, BB, B, and CCC The corresponding Moody’s ratings are Aaa, Aa, A, Baa, Ba, B, and Caa Bonds with ratings of BBB (or Baa) and above are considered to be “investment grade”.

E N D
Credit Risk Chapter 22
Credit Ratings • In the S&P rating system, AAA is the best rating. After that comes AA, A, BBB, BB, B, and CCC • The corresponding Moody’s ratings are Aaa, Aa, A, Baa, Ba, B, and Caa • Bonds with ratings of BBB (or Baa) and above are considered to be “investment grade”
Historical Data Historical data provided by rating agencies are also used to estimate the probability of default
Cumulative Ave Default Rates (%) (1970-2006, Moody’s, Table 22.1, page 490)
Interpretation • The table shows the probability of default for companies starting with a particular credit rating • A company with an initial credit rating of Baa has a probability of 0.181% of defaulting by the end of the first year, 0.506% by the end of the second year, and so on
Do Default Probabilities Increase with Time? • For a company that starts with a good credit rating default probabilities tend to increase with time • For a company that starts with a poor credit rating default probabilities tend to decrease with time
Default Intensities vs Unconditional Default Probabilities • The default intensity (also called hazard rate) is the probability of default for a certain time period conditional on no earlier default • The unconditional default probability is the probability of default for a certain time period as seen at time zero • What are the default intensities and unconditional default probabilities for a Caa or below rate company in the third year? [(39.717%-30.494%)/(1-30.494%)]
Define V(t) as cumulative probability of the company surviving to time t.
Recovery Rate The recovery rate for a bond is usually defined as the price of the bond immediately after default as a percent of its face value
Estimating Default Probabilities • Alternatives: • Use Bond Prices • Use CDS spreads • Use Historical Data • Use Merton’s Model
Using Bond Prices Average default intensity(h) over life of bond is approximately where s is the spread of the bond’s yield over the risk-free rate and R is the recovery rate 显然这样估计出来的是风险中性违约概率。
More Exact Calculation • Assume that a five year corporate bond pays a coupon of 6% per annum (semiannually). The yield is 7% with continuous compounding and the yield on a similar risk-free bond is 5% (with continuous compounding) • Price of risk-free bond is 104.09; price of corporate bond is 95.34; expected loss from defaults is 8.75 • Suppose that the probability of default is Q per year and that defaults always happen half way through a year (immediately before a coupon payment).
Calculations continued • We set 288.48Q = 8.75 to get Q = 3.03% • This analysis can be extended to allow defaults to take place more frequently • With several bonds we can use more parameters to describe the default probability distribution
The Risk-Free Rate • The risk-free rate when default probabilities are estimated is usually assumed to be the LIBOR/swap zero rate (or sometimes 10 bps below the LIBOR/swap rate) • To get direct estimates of the spread of bond yields over swap rates we can look at asset swaps
Real World vs Risk-Neutral Default Probabilities • The default probabilities backed out of bond prices or credit default swap spreads are risk-neutral default probabilities • The default probabilities backed out of historical data are real-world default probabilities
A Comparison • Calculate 7-year default intensities from the Moody’s data (These are real world default probabilities) • Use Merrill Lynch data to estimate average 7-year default intensities from bond prices (these are risk-neutral default intensities) • Assume a risk-free rate equal to the 7-year swap rate minus 10 basis point
Real World vs Risk Neutral Default Probabilities, 7 year averages (Table 22.4, page 495)
The calculation of default intensities using historical data are based on equation(22.1) and table 22.1. From equation (22.1),we have • Where is the average default intensity(or hazard rate)by time t and Q(t) is the cumulative probability of default by time t. The value of Q(7) are taken directly from Table 22.1.Consider, for example, an A-rated company. The value of Q(7) is 0.00759.The average 7-year default intensity is therefore
The calculations using bond prices are based on equation(22.2)and bond yields published by Merrill Lynch. The results shown are averages between December 1996 and Oct. 2007.The recovery rate is assumed to be 40% and, the risk-free interest rate is assumed to be the 7-year swap rate minus 10 basis points. Foe example, for A-rated bonds the average Merrill Lynch yield was 5.993%. The average swap rate was 5.398%, so that the average risk-free rate was 5.298%. This gives the average 7-year default probability as
Possible Reasons for These Results • Corporate bonds are relatively illiquid • The subjective default probabilities of bond traders may be much higher than the estimates from Moody’s historical data • Bonds do not default independently of each other. This leads to systematic risk that cannot be diversified away. • Bond returns are highly skewed with limited upside. The non-systematic risk is difficult to diversify away and may be priced by the market
Which World Should We Use? • We should use risk-neutral estimates for valuing credit derivatives and estimating the present value of the cost of default • We should use real world estimates for calculating credit VaR and scenario analysis
Merton’s Model • Merton’s model regards the equity as an option on the assets of the firm • In a simple situation the equity value is max(VT -D, 0) where VT is the value of the firm and Dis the debt repayment required
Equity vs. Assets An option pricing model enables the value of the firm’s equity today, E0, to be related to the value of its assets today, V0, and the volatility of its assets, sV
Volatilities This equation together with the option pricing relationship enables V0 and sV to be determined from E0 and sE
Example • A company’s equity is $3 million and the volatility of the equity is 80% • The risk-free rate is 5%, the debt is $10 million and time to debt maturity is 1 year • Solving the two equations yields V0=12.40 and sv=21.23%
Example continued • The probability of default is N(-d2) or 12.7% • The market value of the debt is V0-E0= 9.40 • The present value of the promised payment is 9.51 • The expected loss is about (9.51-9.4)/9.51=1.2% • The recovery rate is 91%
The Implementation of Merton’s Model (e.g. Moody’s KMV) • Moody公司则利用股票可视为公司资产期权这一思想计算出风险中性世界的违约距离(如图1所示),之后再利用其拥有的海量历史违约数据库,建立起风险中性违约距离与现实世界违约率之间的对应关系,从而得到预期违约频率(Expected Default Frequency, EDF),作为违约概率的预测指标。 • 图2就是Moody公司用这种方法计算出来的贝尔斯登预期违约频率时间序列。从图上可以看出,在2008年3月14日贝尔斯登被摩根大通接管前后,其预期违约频率最高飙升到80%左右。可见,从股票价格中提炼出来的违约概率具有很强的信息功能。
从期权价格中可以推导出风险中性违约概率 • 运用上述方法,我们就可根据2008年3月14日贝尔斯登将于2008年3月22日到期的期权价格,计算出贝尔斯登的风险中性违约概率和公司价值的概率分布(如图13所示)。贝尔斯登于2008年3月14日被摩根大通接管。图13显示,市场对贝尔斯登一周后的命运产生巨大分歧,公司价值大涨大跌的概率远远大于小幅变动的概率,这样的分布与正常情况的分布有天壤之别。可见期权价格可以让我们清楚地看出市场在非常时期对未来的特殊看法。
风险中性违约概率 • 风险中性违约概率虽然不同于现实概率,但其变化可以反映现实世界违约概率的变化。在金融危机时期,它可能比信用违约互换(CDS)的价差能更敏感地反映出违约概率的变化(如图14所示)。在贝尔斯登于2008年3月14日被接管前后,根据上述方法计算出来的风险中性概率每天的变化比CDS的价差更敏感。这是因为在金融危机期间,金融机构自身的信用度大幅降低,造成在场外(OTC)市场交易的CDS交易量急剧萎缩,价差大幅扩大,信号失真。 CDS价差所隐含的信息将在本文第五点讨论。
Credit Risk in Derivatives Transactions (page 491-493) Three cases • Contract always an asset • Contract always a liability • Contract can be an asset or a liability
General Result • Assume that default probability is independent of the value of the derivative • Consider times t1, t2,…tn and default probability is qi at time ti. The value of the contract at time ti is fi and the recovery rate is R • The loss from defaults at time ti is qi(1-R)E[max(fi,0)]. • Defining ui=qi(1-R) and vi as the value of a derivative that provides a payoff of max(fi,0) at time ti, the cost of defaults is
Credit Risk Mitigation • Netting • Collateralization • Downgrade triggers
Default Correlation • The credit default correlation between two companies is a measure of their tendency to default at about the same time • Default correlation is important in risk management when analyzing the benefits of credit risk diversification • It is also important in the valuation of some credit derivatives, eg a first-to-default CDS and CDO tranches.
Correlation • Correlation measures the degree to which the probability of one event happening moves in sync with the probability of another event happening. • In terms of default correlation, • Zero correlation means that the default of one company has no bearing on the default of another company – the companies are completely independent of each other. • Perfect positive correlation means that if one company defaults, the other will automatically follow suit. • Perfect negative correlation means that if one company defaults the other one will certainly not.
Factors of Default Correlation • macroeconomic environment: good economy = low number of defaults • same industry or geographic area: companies can be similarly or inversely affected by an external event • credit contagion: connections between companies can cause a ripple effect
Binomial Correlation Measure (page 508) • uses a set of rules to change time-to-default values into either the value 1 or 0, so that if a company defaults within time T, it is assigned the variable 1, and otherwise it is assigned a 0.
Binomial Correlation continued Denote Qi(T) as the probability that company i will default between time zero and time T, and Pij(T) as the probability that both i and j will default. The default correlation measure is
David Li • Statistician who moved over to business • Worked at a credit derivative market in 1997 and knew about the need to measure default correlation • Colleagues in actuarial science working on solution for death correlation, a function called the copula • “Default is like the death of a company, so we should model this the same way as we model human life” (Li) (Whitehouse, Salmon)