Download
1 / 5
90 likes | 336 Views
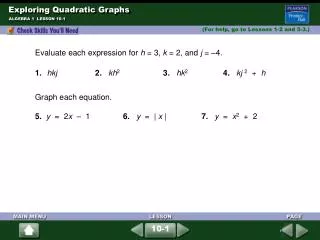
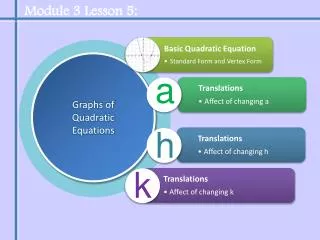
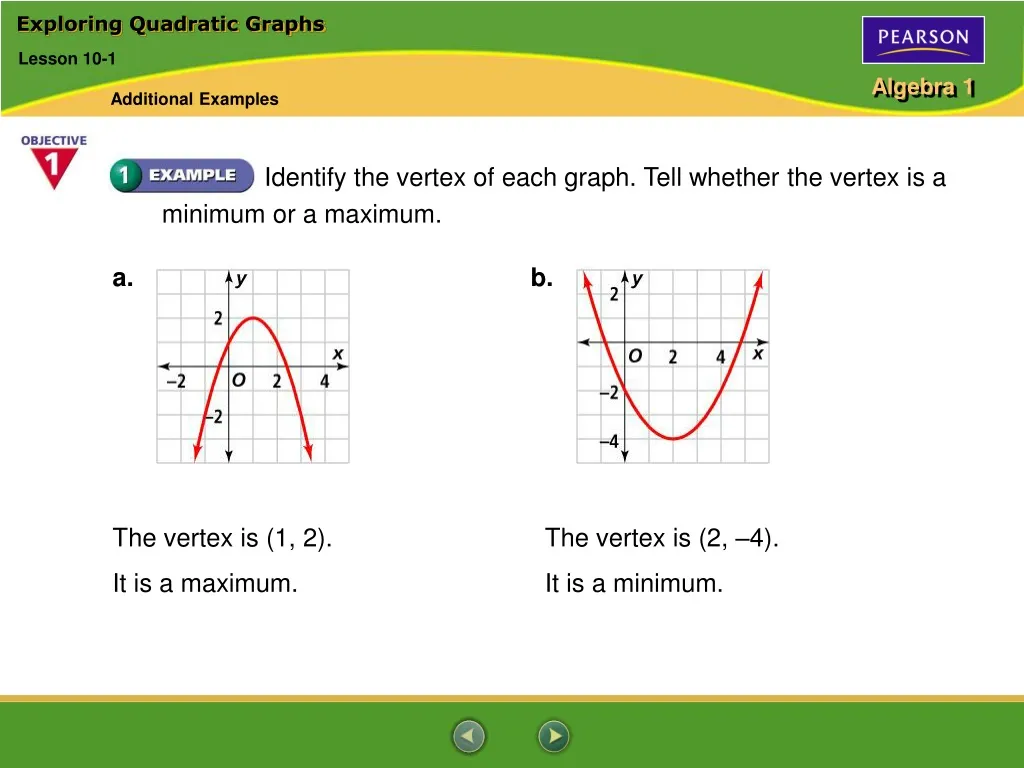
Exploring Quadratic Graphs. Lesson 10-1. Additional Examples. Identify the vertex of each graph. Tell whether the vertex is a minimum or a maximum. a. b. The vertex is (1, 2). The vertex is (2, – 4). It is a maximum. It is a minimum. 1 3. x y = x 2 ( x, y ). 1 3.

E N D
Exploring Quadratic Graphs Lesson 10-1 Additional Examples Identify the vertex of each graph. Tell whether the vertex is a minimum or a maximum. a. b. The vertex is (1, 2). The vertex is (2, –4). It is a maximum. It is a minimum.
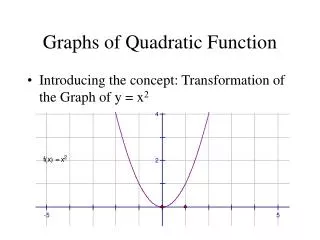
1 3 xy= x2 (x, y) 1 3 0 (0)2= 0(0, 0) 1 3 1 3 1 3 2 (2)2= 1(2, 1 ) 1 3 3 (3)2= 3(3, 3) Exploring Quadratic Graphs Lesson 10-1 Additional Examples Make a table of values and graph the quadratic function y= x2. 1 3
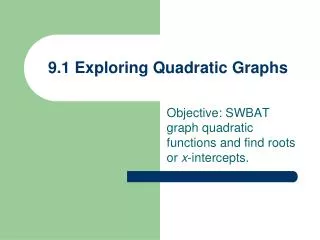
1 2 (x) = –x2 (x) = –3x2 (x) = x2 1 2 Of the three graphs, (x) = x2 is the widest and (x) = –3x2 is the narrowest. 1 2 So, the order from widest to narrowest is (x) = x2, (x) = –x2, (x) = –3x2. Exploring Quadratic Graphs Lesson 10-1 Additional Examples Use the graphs below. Order the quadratic functions (x) = –x2, (x) = –3x2,and (x) = x2 from widest to narrowest graph. 1 2
xy= 3x2 y= 3x2 – 2 2 12 10 1 3 1 0 0 2 –1 3 1 2 12 10 Exploring Quadratic Graphs Lesson 10-1 Additional Examples Graph the quadratic functions y= 3x2 and y= 3x2 – 2. Compare the graphs. The graph of y= 3x2 – 2 has the same shape as the graph of y= 3x2, but it is shifted down 2 units.
Height h is dependent on time t. th = –16t2 + 26 0 26 1 10 2 –38 Graph t on the x-axis and h on the y-axis. Use positive values for t. Exploring Quadratic Graphs Lesson 10-1 Additional Examples A monkey drops an orange from a branch 26 ft above the ground. The force of gravity causes the orange to fall toward Earth. The function h = –16t2 + 26 gives the height of the orange, h, in feet after t seconds. Graph this quadratic function.