Download
1 / 35
360 likes | 1.25k Views
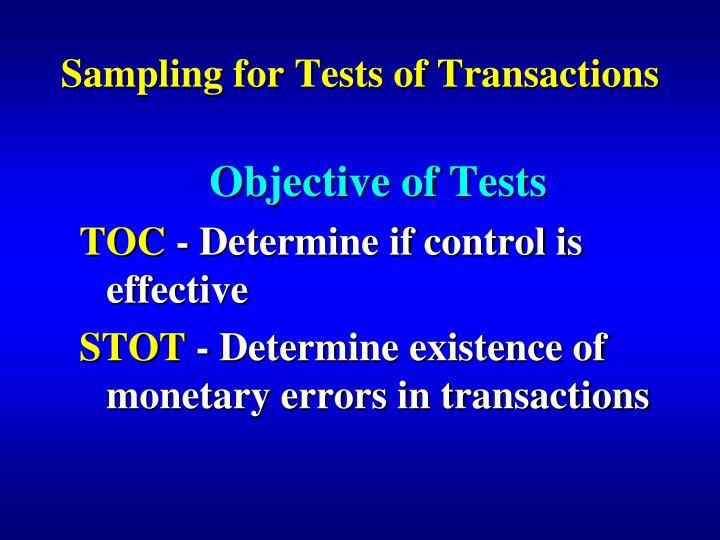
Sampling for Tests of Transactions. Objective of Tests TOC - Determine if control is effective STOT - Determine existence of monetary errors in transactions. Objective of TOC and STOT. Both are tests of transactions Evaluated yes / no control is / is not effective

E N D
Sampling for Tests of Transactions • Objective of Tests • TOC - Determine if control is effective • STOT- Determine existence of monetary errors in transactions
Objective of TOC and STOT • Both are tests of transactions • Evaluated yes / no • control is / is noteffective • transaction is / is notcorrectly recorded • Auditor should consider qualitative aspectsof deviations
Evaluation of Results • TOC- assessment of control risk • affects PDR and evidence (STOT and TODB) • STOT - are transactions correctly recorded • affects extend to TODB • also has implications for control risk
Risk Model • TOC CR • Lower CR PDR • Evidence • (less STOT & TODB for related objective)
Risk Model • STOT • CR PDR • STOT affect CR assessment. • Good results also lowers TODB • (STOT and TODB both part of PDR)
Relationship between selection and evaluation • Statistical Sampling must be • evaluation random(probabilistic) • Nonstatistical Judgmental selection • evaluation allowed, but random • selection is still preferable • Point: Random selection is always desirable
Selection Methods • Random - Each item has equal chance of selection (TOT) • Probabilistic - each item has a know probability of selection (TODB)
Sampling Risk • Sampling Risk- Risk the sample is not representative; inherent with sampling. Reduce by: • Using appropriate sampling • Increasing sample size • Is a random sample representative?
Nonsampling Risk • Nonsampling error- is the risk the auditor fails to uncover existing errors in the sample. Reduce by: • Carefully defining and performing the test(text example of incorrectly selecting an existence sample from shipping documents) • Control over sample
15-27 (a) - Test with attributes sampling? • Review CR journal for unusual transactions. • Trace prelisting amts. to CR journal • Compare info on prelisting with CR journal • Examine remittance advices to see if discounts approved • Trace entries from prelist to deposit
15-27 (a) - Test with attributes sampling? • Review CR journal for unusual transactions. • Trace prelisting amts. to CR journal • Compare info on prelisting with CR journal • Examine remittance advices to see if discounts approved • Trace entries from prelist to deposit
Sample Selection • 2. Trace prelisting amts. to CR journal (completeness) • 3. Compare info on prelisting with CR journal (accuracy) • 4. Examine remittance advices to see if discounts approved (accuracy) • 5. Trace entries from prelist to deposit (completeness) • Draw sample from prelist (source for directional completeness tests)
Sampling for Exception Rates • Objective- Estimate maximum error rate in population based on sample • determine if control can be relied on or results for STOT acceptable
Maximum Error Rate (CUER) • Sample exception rate (SER) is best estimator of population exception rate • Maximum rate is the computed upper exception rate (CUER) and includes allowance for sampling risk (ASR) • CUER = SER + ASR
Larger n • sample exception rateCUER • (SER)
Variable Description Definition • EPER Expected Last year’s results • population or auditor exception rate expectations • TER Tolerable Maximum rate • (precision) exception that auditor will rate allow. Lower for imp. objectives • ARACR Acceptable Risk of relying • (confidence risk of on control/STOT level) assessing CR when it is too low ineffective
Changes in variables on sample size • Planning relation: • TER = EPER + ASR (allowance for sample risk) • Increases in sample size lower sampling risk
Effect on Changes in Variables on • Sample Size • Change in Effect • Factor on n Reason • EPER increase Increase Less allowance for • sampling risk for given TER • TERincrease Decrease More allowance for sampling risk for given EPER • ARACR Decrease Less reliance on increase controls; less evidence needed
The biggest effect on sample size is TER - EPER • Bigger differences provides larger allowance for sampling risk
15-22(a) • If all other factors remain constant, changing ARACR from 10% to 5% would cause sample size to: • 1. Increase • 2. Remain the same • 3. Decrease • 4. Become indeterminate
Problem 15-28 Part c: (increase in ARACR) • 12 34 • ARACR 10 5 5 5 • TER 6 6 5 6 • EPER 2 2 2 2 • Population • size 1,000 100,000 6,000 1,000 • Sample • Size 88 127 181 127
Problem 15-28 Part c: (increase in TER) • 1 2 34 • ARACR 10 5 5 5 • TER 6 6 5 6 • EPER 2 2 2 2 • Population • size 1,000 100,000 6,000 1,000 • Sample • Size 88 127 181127
Problem 15-28 Part c: (increase in EPER) • 5 67 • ARACR 10 10 5 • TER 20 20 2 • EPER 8 2 0 • Population • size 500 500 1,000,000 • Sample • Size 25 18149
Problem 15-28 Part c: (increase in POP) • 1 2 3 4 • ARACR 10 5 5 5 • TER 6 6 5 6 • EPER 2 2 2 2 • Population • size 1,000 100,000 6,000 1,000 • Sample • Size 88 127181127
Evaluating the Sample • TER, ARACR, and n as before • SER = Sample exception rate • (# of exceptions/n) • CUER = maximum error rate • = SER + ASR
Evaluation Decision - Nonstatistical sampling • Approach 1: • Accept if CUER < TER • Approach 2: • ASR = TER - SER • Accept if ASR large enough (SER sufficiently less than TER)
Options when CUER exceeds TER • 1. Increase sample size - lowers ASR and CUER • (may also reduce SER if initial sample not representative) • 2. Don’t rely upon control/STOT • CR and substantive tests
Options when CUER > TER • TOC fails -can increase STOT or TODB. Usually increase STOT • STOT fails- Increase TODB • 3. Revise TER or ARACR - • usually not recommended
Change in variables on CUER • Evaluation relation: • CUER = SER + ASR • Remember: increase in sample size lowers sampling risk • Increase in n may also lower SER if initial sample not representative
Effect of Changes in Variables on CUER • Change in Effect on • Factor CUER Reason • SER Increase Increase CUER = SER+ASR • n increase Decrease Lower sampling risk • ARACR Decrease Less reliance on • increase controls; threshold for accepting a control is lower
Lower ARACR is farther out curve • Larger n • sample exception rateCUER • (SER) 5% ARACR
15-23 (a) • An auditor estimates with 10% ARACR (90% confidence) that CUER is between 4% and 6%. The auditor’s major concern is that there is one chance in 20 that the true exception rate is: • 1. More than 6% • 2. Less than 6% • 3. More than 4% • 4. Less than 4%
Problem 15-29 Part c: (decrease ARACR) • 1 23 4 • ARACR 10 5 5 5 • Population Size 5,000 5,000 5,000 50,000 • Sample size 200 200 50 200 • Number of • exceptions 4 4 1 4 • CUER 4.0 4.59.1 4.5
Problem 15-29 Part c:(decrease n) • 1 2 3 4 • ARACR 10 5 5 5 • Population Size 5,000 5,000 5,000 50,000 • Sample size 200 200 50 200 • Number of • exceptions 4 4 1 4 • CUER 4.0 4.5 9.1 4.5
Problem 15-29 Part c:(decrease exceptions) • 5 6 7 8 • ARACR 5 5 5 5 • Population Size 500 900 5,000 500 • Sample size 100 100 100 25 • Number of • exceptions 2 10 0 0 • CUER 6.2 16.4 3.0 11.3